. 2011 Apr;121(4):1596-607.
doi: 10.1172/JCI44909. Epub 2011 Mar 14.

Single-cell Tsc1 knockout during corticogenesis generates tuber-like lesions and reduces seizure threshold in mice

Affiliations

Single-cell Tsc1 knockout during corticogenesis generates tuber-like lesions and reduces seizure threshold in mice

David M Feliciano et al. J Clin Invest. 2011 Apr.

Abstract

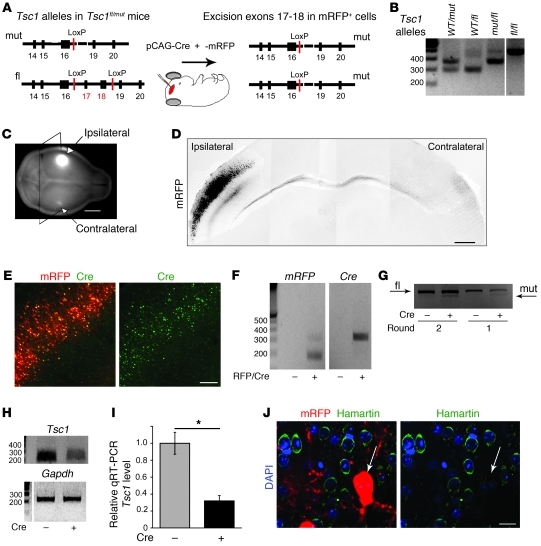
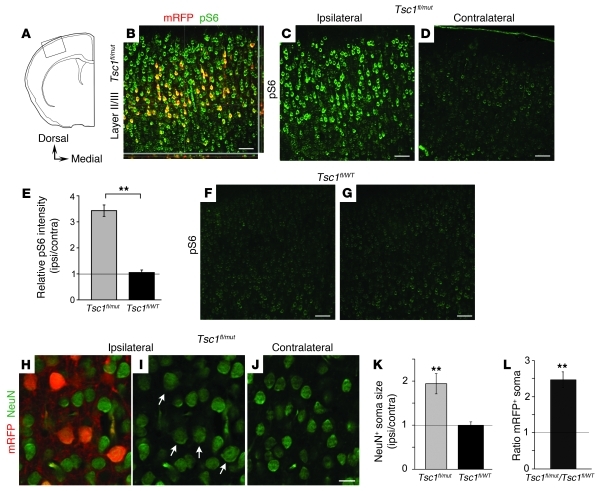
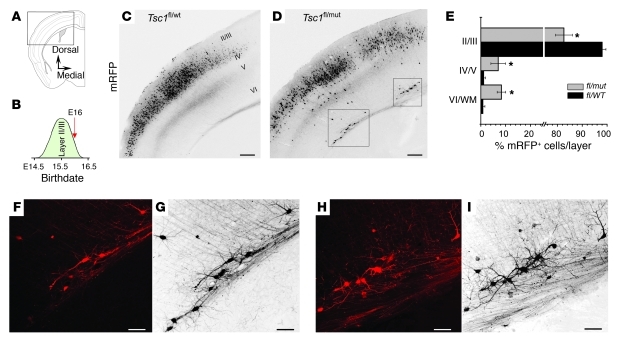
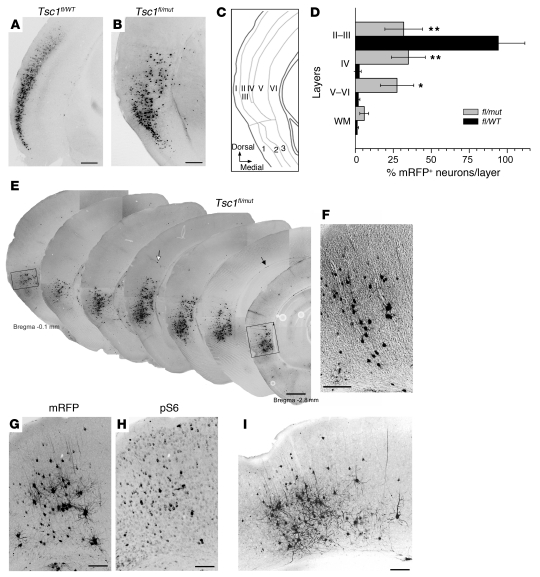
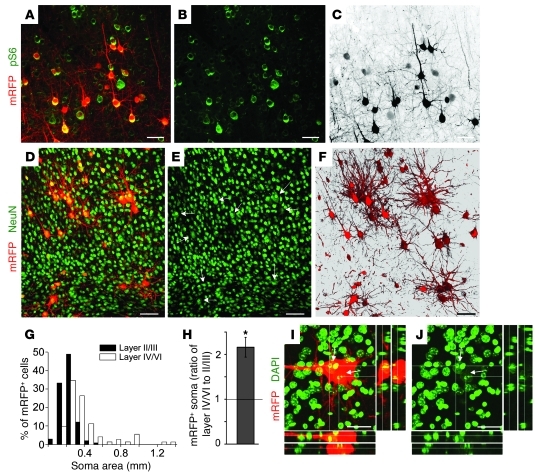
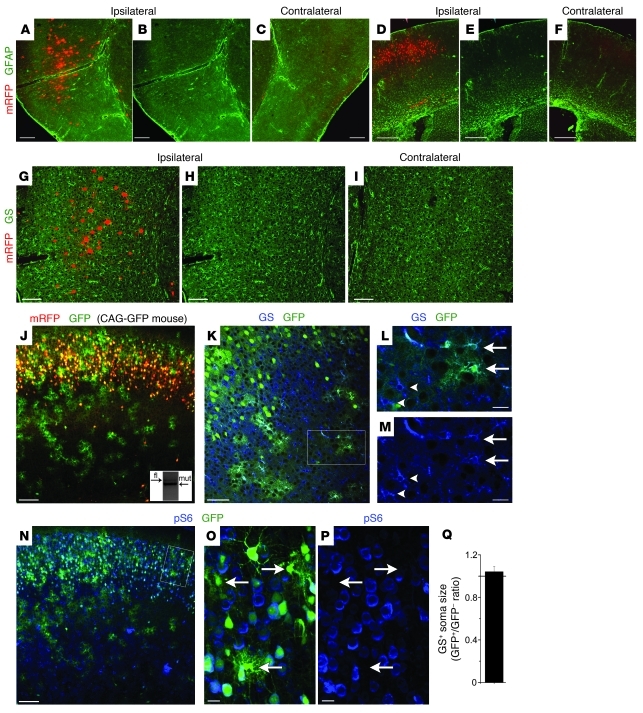
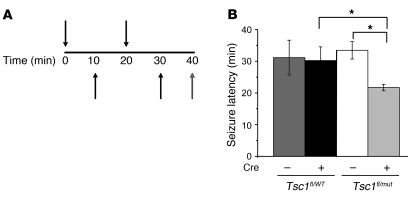
Tuberous sclerosis complex (TSC) is an autosomal dominant disorder characterized by mutations in Tsc1 or Tsc2 that lead to mammalian target of rapamycin (mTOR) hyperactivity. Patients with TSC suffer from intractable seizures resulting from cortical malformations known as tubers, but research into how these tubers form has been limited because of the lack of an animal model. To address this limitation, we used in utero electroporation to knock out Tsc1 in selected neuronal populations in mice heterozygous for a mutant Tsc1 allele that eliminates the Tsc1 gene product at a precise developmental time point. Knockout of Tsc1 in single cells led to increased mTOR activity and soma size in the affected neurons. The mice exhibited white matter heterotopic nodules and discrete cortical tuber-like lesions containing cytomegalic and multinucleated neurons with abnormal dendritic trees resembling giant cells. Cortical tubers in the mutant mice did not exhibit signs of gliosis. Furthermore, phospho-S6 immunoreactivity was not upregulated in Tsc1-null astrocytes despite a lower seizure threshold. Collectively, these data suggest that a double-hit strategy to eliminate Tsc1 in discrete neuronal populations generates TSC-associated cortical lesions, providing a model to uncover the mechanisms of lesion formation and cortical hyperexcitability. In addition, the absence of glial reactivity argues against a contribution of astrocytes to lesion-associated hyperexcitability.


Figures

Figure 1
Figure 1. In utero single-cell knockout of Tsc1 in cortical cells.
(A) Exons/introns of mutant and floxed alleles before and after Cre-induced excisions of exons 17–18 in the floxed allele. (B) PCR gels of genomic DNA from the mouse lines. (C) P28-fixed brains containing a cortical area electroporated with mRFP. Fluorescent projections from the ipsilateral side containing mRFP+ cells are visible. (D) Coronal section containing electroporated mRFP+ cells in the ipsilateral side sent projections to the contralateral cortex from a P15 Tsc1fl/WT mouse electroporated at E15. Shown is a composite of several images. (E) mRFP+ (red) and Cre:GFP+ (green) cells in cortex of a P15 Tsc1fl/WT mouse electroporated at E15. (F) PCR gels of DNA plasmid for mRFP and Cre extracted from microdissected mRFP+ cell–containing cortex and contralateral cortex in P7 Tsc1fl/mut mice. (G) PCR gels from genomic DNA obtained from ipsilateral (mRFP-containing cells) and contralateral cortical tissue microdissected from slices obtained from a P28 Tsc1fl/fl mouse electroporated at E16. (H) PCR gels of Tsc1 and Gapdh cDNA obtained from ipsilateral and contralateral P7 Tsc1fl/mut cortex. (I) Relative abundance of Tsc1 mRNA measured by qRT-PCR and obtained from ipsilateral (mRFP-containing cells) and contralateral cortical tissue microdissected from slices obtained from a P28 Tsc1fl/mut mouse electroporated at E16. *P < 0.005. (J) Hamartin immunostaining (green), mRFP fluorescence (red), and DAPI nuclear counterstain (blue) in ipsilateral cortex from a P28 Tsc1fl/mut mouse electroporated at E15. Arrows indicate the mRFP+ cell that stained negative for hamartin (green). Scale bars: 3 mm (C), 350 μm (D), 140 μm (E), 30 μm (J). Lanes in B and H were run on the same gel but were noncontiguous (white lines).
Figure 2
Figure 2. Single-cell Tsc1 deletion increases mTOR activity and cell size in Tsc1fl/mut mice.
(A) Diagram of a coronal section illustrating the cortical ROI. (B) pS6 immunostaining (green) in the ipsilateral mRFP+ cell–containing cortex from a P15 Tsc1fl/mut mouse electroporated at E16. (C, D, F, and G) pS6 (Ser240/244) immunostaining in the ipsilateral and contralateral cortex from P15 Tsc1fl/mut (C and D) and Tsc1fl/WT mice (F and G) electroporated at E16. (E) Bar graphs of the ratio of pS6 intensity in the ipsilateral versus contralateral cortical layer II/III from Tsc1fl/mut mice (n = 9) and Tsc1fl/WT mice (n = 6, P15 and P28 pooled). **P < 0.005. (HJ) NeuN immunostaining (green) in the ipsilateral mRFP+ cell–containing cortex (H and I; I does not show the red channel) and the contralateral cortex (J) from a P15 Tsc1fl/mut electroporated at E16. (K) Bar graph of ipsilateral/contralateral NeuN+ soma size in cortical layer II/III from Tsc1fl/mut (n = 8) and Tsc1fl/WT mice (n = 5, P15 and P28 pooled). **P < 0.005. (L) Bar graph of the ratio of mRFP+ soma size in the Tsc1fl/mut versus Tsc1fl/WT cortical layer II/III (n = 6 and 5 mice, respectively). **P < 0.005. Scale bars: 70 μm (BD, F, and G) and 15 μm (HJ).
Figure 3
Figure 3. Heterotopic nodule formation with cytomegalic neurons after electroporation at E16.
(A) Diagram of a coronal section illustrating the cortical ROI. (B) Diagram illustrating the approximate birthdate of cortical layer II/III neurons. The red arrow indicates the time of electroporation at E16. (C and D) Photographs of mRFP+ cells in the somato-sensory cortex in coronal sections from P15 Tsc1fl/WT (C) and Tsc1fl/mut mice (D) electroporated at E16. (E) Bar graphs illustrating the distribution (as a percentage) of mRFP+ cells across cortical layers in Tsc1fl/WT and Tsc1fl/mut mice. WM, white matter. *P < 0.05. (FI) Confocal images of mRFP+ cells in one optical section (red, F and H) and a Z-stack (19.5 μm, black, G and I) from the boxed regions in D. Scale bars: 140 μm (C and D) and 70 μm (FI).
Figure 4
Figure 4. Single-cell Tsc1 deletion at E15 generates tuber-like lesions in Tsc1fl/mut mice.
(A and B) Photographs of mRFP+ cells in P28 coronal sections from Tsc1fl/WT (A) and Tsc1fl/mut mice (B) electroporated at the onset of layer II/III birth (E15). (C) Diagram of a coronal section illustrating the cortical ROI and the regions of the cortex, consisting of 6, 5, or 3 layers. (D) Bar graphs illustrating the distribution (as a percentage) of mRFP+ cells across cortical layers in Tsc1fl/WT (n = 7) and Tsc1fl/mut mice (n = 4). *P < 0.05; **P < 0.005. (E) Photographs of mRFP+ cells in P28 serial coronal sections (bregma –0.08 to –2.8 mm) from a Tsc1fl/WT mouse electroporated at E15. The black arrows point to scattered white matter cells; white arrow points to a small group of mRFP+ cells. (F) Photograph of mRFP+ cells on a DIC image in the rectangle from the most rostral section in E, illustrating a radial column of migration. (G and H) pS6 immunostaining and corresponding mRFP+ cells in a coronal section from a P28 Tsc1fl/mut mouse. (I) Photograph of mRFP+ cells in the rectangle of the most caudal section in E. Scale bars: 300 μm (A, B, and E), 100 μm (F), 70 μm (G and H), and 140 μm (I). Images are from mice electroporated at E15.
Figure 5
Figure 5. pS6+ enlarged cells are neuronal, dysmorphic, and multinucleated.
(A and B) Confocal photographs of mRFP+ cells (red) and pS6 immunostaining (green) in cortical layer V–VI. (C) Black and white image of the red fluorescence in A, illustrating the mosaic nature of cell sizes. (D and E) Confocal photographs of mRFP+ cells (red) and NeuN (green) immunostaining overlay in cortical layer V (E does not show the red channel). Arrows in E denote electroporated cells, which colocalized with NeuN staining. (G) Histogram of cell area in upper and deeper layers in cortical sections from Tsc1fl/mut mice. (H) Bar graph of the ratio of the soma area of mRFP+ cells in layers IV/VI versus II/III in Tsc1fl/mut mice. *P < 0.005. (I and J) Confocal Z-stack photographs and projections of an mRFP+ cell (red) and DAPI (pseudo-colored green) in layer VI. All the images are from P28 Tsc1fl/mut mice electroporated at E15. Scale bars: 70 μm (AC), 40 μm (DF), 50 μm (I and J).
Figure 6
Figure 6. Lack of astrogliosis in the tuber-like lesions.
(AF) Photograph of mRFP+ cells (red) and GFAP immunostaining (green) in the ipsilateral (A, B, D, and E) and contralateral (C and F) in P28 and P15 Tsc1fl/mut mice electroporated at E15 (AC) and E16 (DF), respectively. (GI) Photograph of mRFP+ cells (red) and GS (green) immunostaining in the ipsilateral (G and H) and contralateral (I) in P28 Tsc1fl/mut mice electroporated at E15. (J and K) Photograph of mRFP fluorescence (red, J), GS (blue, K), and GFP fluorescence (green) in a P15 CAG-GFP × Tsc1fl/mut mouse electroporated with pCAG-mRFP and pCAG-Cre:GFP at E16. Inset in J shows PCR gels from genomic DNA obtained from E16-electroporated cortical tissue containing electroporated astrocytes but no electroporated neurons, microdissected from slices obtained from a P28 Tsc1fl/fl mouse in which no mRFP+ neurons were visible. (L and M) Higher-magnification photographs of GS staining and GFP fluorescence from the boxed region in K. Arrows indicate GFP+ astrocytes (i.e., GS+), and arrowheads indicate GFP astrocytes that exhibit the same soma size. (N) Photograph of GFP fluorescence (green) and pS6 immunostaining (blue) in a CAG-GFP × Tsc1fl/mut mouse electroporated at E16. (O and P) Higher-magnification photographs of pS6 staining in GFP+ cells from the boxed region in N. Arrows point to GFP+ astrocytes that are pS6 negative. (Q) Quantification of Tsc1fl/mut and Tsc1fl/WT astrocytic soma size, as outlined by GS staining. Scale bars: 300 μm (AF), 140 μm (GI), 70 μm (J, K, and N), 20 μm (L, M, O, and P).
Figure 7
Figure 7. Tsc1fl/mut mice with lesions exhibit a lower seizure threshold.
(A) Diagram illustrating the protocol of pentylenetetrazole injections. (B) Seizure latency in electroporated and non-electroporated P15 Tsc1fl/WT and Tsc1fl/mut mice. *P < 0.05.

References

    1. Osborne JP, Fryer A, Webb D. Epidemiology of tuberous sclerosis. Ann N Y Acad Sci. 1991;615:125–127. doi: 10.1111/j.1749-6632.1991.tb37754.x. - DOI - PubMed
    1. European Chromosome 16 Tuberous Sclerosis Consortium. Identification and characterization of the tuberous sclerosis gene on chromosome 16. Cell. 1993;75(7):1305–1315. doi: 10.1016/0092-8674(93)90618-Z. - DOI - PubMed
    1. Curatolo P, Seri S, Verdecchia M, Bombardieri R. Infantile spasms in tuberous sclerosis complex. Brain Dev. 2001;23(7):502–507. doi: 10.1016/S0387-7604(01)00300-X. - DOI - PubMed
    1. Holmes GL, Stafstrom CE. Tuberous sclerosis complex and epilepsy: recent developments and future challenges. Epilepsia. 2007;48(4):617–630. doi: 10.1111/j.1528-1167.2007.01035.x. - DOI - PubMed
    1. Webb DW, Fryer AE, Osborne JP. Morbidity associated with tuberous sclerosis: a population study. Dev Med Child Neurol. 1996;38(2):146–155. doi: 10.1111/j.1469-8749.1996.tb12086.x. - DOI - PubMed

Publication types

MeSH terms