

Detecting density dependence in recovering seal populations
- PMID: 21404823
- PMCID: PMC3357728
- DOI: 10.1007/s13280-010-0091-7
Detecting density dependence in recovering seal populations
Abstract
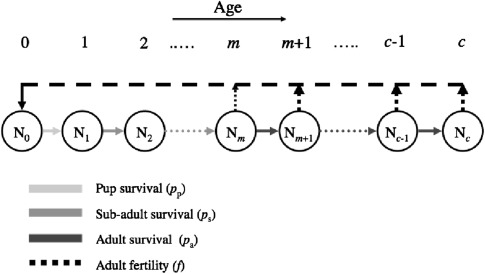
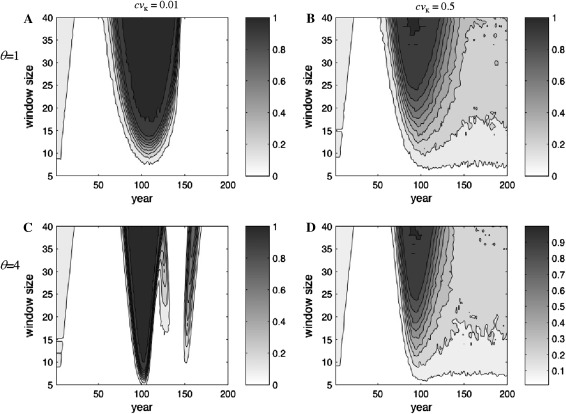
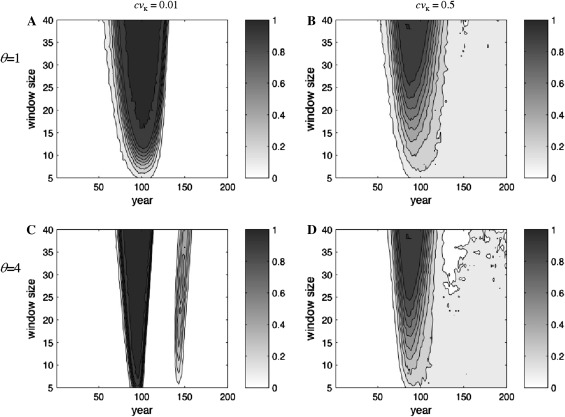
Time series of abundance estimates are commonly used for analyses of population trends and possible shifts in growth rate. We investigate if trends in age composition can be used as an alternative to abundance estimates for detection of decelerated population growth. Both methods were tested under two forms of density dependence and different levels of environmental variation in simulated time series of growth in Baltic gray seals. Under logistic growth, decelerating growth could be statistically confirmed after 16 years based on population counts and 14 years based on age composition. When density dependence sets in first at larger population sizes, the age composition method performed dramatically better than population counts, and a decline could be detected after 4 years (versus 10 years). Consequently, age composition analysis provides a complementary method to detect density dependence, particularly in populations where density dependence sets in late.
Figures

Comment in
-
Detecting density dependence in recovering seal population is difficult: a response to Svensson et al. (2011).Ambio. 2012 Mar;41(2):219-20. doi: 10.1007/s13280-011-0180-2. Epub 2011 Sep 9. Ambio. 2012. PMID: 22396103 Free PMC article. No abstract available.
References
-
- Bengtsson JL, Siniff DB. Reproductive aspects of female Crabeater seals (Lobodon carcinophagus) along the Antarctic Peninsula. Canadian Journal of Zoology. 1981;59:92–102. doi: 10.1139/z81-015. - DOI
-
- Benton TG, Lapsley CT, Beckerman AP. The population response to environmental noise: Population size, variance and correlation in an experimental system. Journal of Animal Ecology. 2002;71:320–332. doi: 10.1046/j.1365-2656.2002.00601.x. - DOI
-
- Bowen WD, McMillan JI, Blanchard W. Reduced population growth of gray seals at Sable Island: Evidence from pup production and age of primiparity. Marine Mammal Science. 2007;23:48–64. doi: 10.1111/j.1748-7692.2006.00085.x. - DOI
Publication types
MeSH terms
LinkOut - more resources
Full Text Sources
