. 2011 Feb;83(2 Pt 1):021907.
doi: 10.1103/PhysRevE.83.021907. Epub 2011 Feb 16.

Protein sliding and hopping kinetics on DNA

Affiliations

Protein sliding and hopping kinetics on DNA

Michael C DeSantis et al. Phys Rev E Stat Nonlin Soft Matter Phys. 2011 Feb.

Abstract

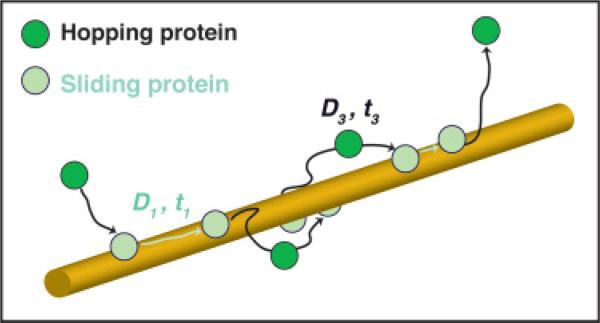
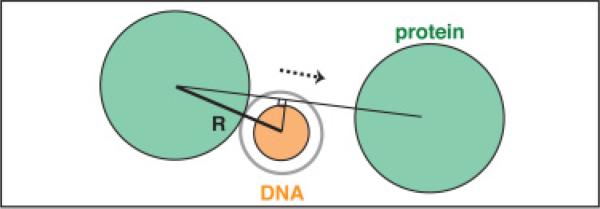
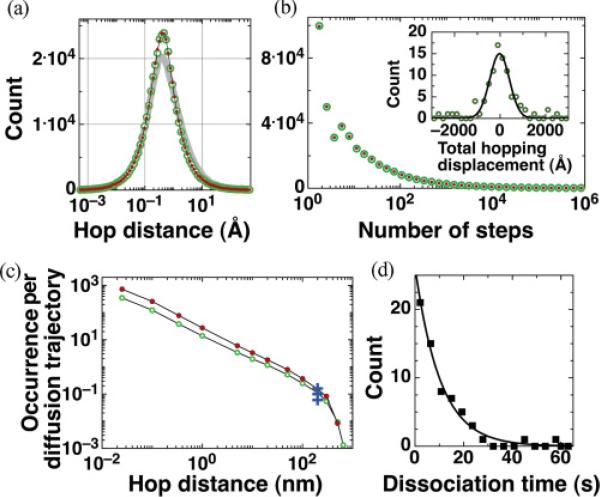
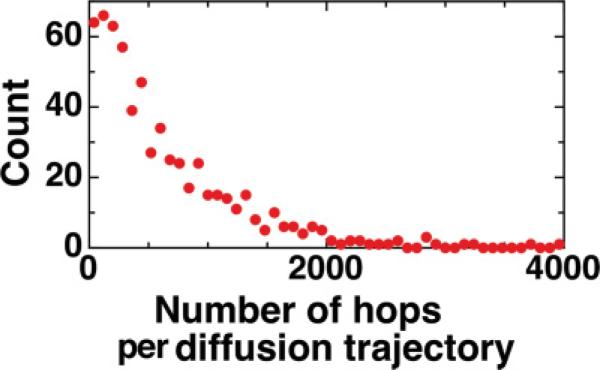
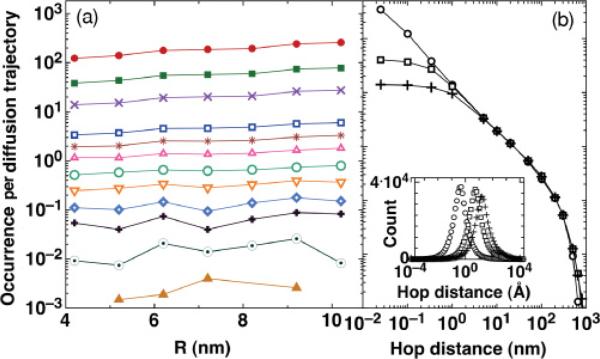
Using Monte Carlo simulations, we deconvolved the sliding and hopping kinetics of GFP-LacI proteins on elongated DNA from their experimentally observed seconds-long diffusion trajectories. Our simulations suggest the following results: (i) in each diffusion trajectory, a protein makes on average hundreds of alternating slides and hops with a mean sliding time of several tens of milliseconds; (ii) sliding dominates the root-mean-square displacement of fast diffusion trajectories, whereas hopping dominates slow ones; (iii) flow and variations in salt concentration have limited effects on hopping kinetics, while in vivo DNA configuration is not expected to influence sliding kinetics; and (iv) the rate of occurrence for hops longer than 200 nm agrees with experimental data for EcoRV proteins.


Figures

FIG. 1
FIG. 1
(Color online) Schematics of a diffusion trajectory showing a protein initially binding to DNA, proceeding to slide (light disks) and hop (dark disks), and finally permanently dissociating from DNA. This example diffusion trajectory has two discernible hops.
FIG. 2
FIG. 2
(Color online) Determination of protein-DNA association. The gray (open) circle marks the effective protein-DNA binding distance. The protein moves ballistically between consecutive steps.
FIG. 3
FIG. 3
(Color online) (a) Distributions of hopping distances along DNA for δ = 0.267 Å and R = 4.2 (green, open circles) and 10.2 nm (red dots), and hopping height for R = 4.2 nm (gray line). (b) Distributions for number of steps per hop for R = 4.2 and 10.2 nm. (Inset) Distribution for total hopping displacement per diffusion trajectory and Gaussian fit (solid line). (c) Number of hops per diffusion trajectory longer than 0.25 Å, and up to hops longer than 800 nm, for R = 4.2 and 10.2 nm. The crosses are experimental data for EcoRV proteins, where the occurrence rate of hops per diffusion trajectory longer than 200 nm are 0.06, 0.1, and 0.16 (the 0.15 value was omitted for clarity) [15]. (d) GFP-LacI total diffusion time t distribution (from experimental data in Ref. [3]). The mean of the exponential fit (solid line) is 10.4 s.
FIG. 4
FIG. 4
(Color online) Distribution of number of hops per diffusion trajectory. The results of 4 × 10⁵ individual hopping simulations constitute a total of 763 protein diffusion trajectories such that 526 hops occur on average per trajectory.
FIG. 5
FIG. 5
(Color online) Distributions for number of hops per diffusion trajectory longer than 0.1, 0.34, 1, 5, 10, 20, 50, 100, 200, 300, 500, and 800 nm (top to bottom in a), (a) for R ranging from 4.2 to 10.2 nm (left to right) and (b) for R = 4.2 nm and δ = 0.267 (circles), 3.4 (empty squares), and 10.2 Å (crosses). (Inset) Hopping distance distributions for the three δ values.

References

    1. Riggs AD, Bougeois S, Cohn M. J. Mol. Biol. 1970;53:401. - PubMed
    1. Halford SE, Marko JF. Nucl. Acids Res. 2004;32:3040. - PMC - PubMed
    1. Wang YM, Austin RH, Cox EC. Phys. Rev. Lett. 2006;97:048302. - PubMed
    1. Klenin KV, Merlitz H, Langowski J, Wu CX. Phys. Rev. Lett. 2006;96:018104. - PubMed
    1. Hu L, Grosberg AY, Bruinsma R. Biophys. J. 2008;95:1151. - PMC - PubMed

Publication types

LinkOut - more resources