Comparative Study
. 2011 Mar 15:5:40.
doi: 10.1186/1752-0509-5-40.

Analog regulation of metabolic demand

Affiliations
Comparative Study

Analog regulation of metabolic demand

Nikolaus Sonnenschein et al. BMC Syst Biol. .

Abstract

Background: The 3D structure of the chromosome of the model organism Escherichia coli is one key component of its gene regulatory machinery. This type of regulation mediated by topological transitions of the chromosomal DNA can be thought of as an analog control, complementing the digital control, i.e. the network of regulation mediated by dedicated transcription factors. It is known that alterations in the superhelical density of chromosomal DNA lead to a rich pattern of differential expressed genes. Using a network approach, we analyze these expression changes for wild type E. coli and mutants lacking nucleoid associated proteins (NAPs) from a metabolic and transcriptional regulatory network perspective.

Results: We find a significantly higher correspondence between gene expression and metabolism for the wild type expression changes compared to mutants in NAPs, indicating that supercoiling induces meaningful metabolic adjustments. As soon as the underlying regulatory machinery is impeded (as for the NAP mutants), this coherence between expression changes and the metabolic network is substantially reduced. This effect is even more pronounced, when we compute a wild type metabolic flux distribution using flux balance analysis and restrict our analysis to active reactions. Furthermore, we are able to show that the regulatory control exhibited by DNA supercoiling is not mediated by the transcriptional regulatory network (TRN), as the consistency of the expression changes with the TRN logic of activation and suppression is strongly reduced in the wild type in comparison to the mutants.

Conclusions: So far, the rich patterns of gene expression changes induced by alterations of the superhelical density of chromosomal DNA have been difficult to interpret. Here we characterize the effective networks formed by supercoiling-induced gene expression changes mapped onto reconstructions of E. coli's metabolic and transcriptional regulatory network. Our results show that DNA supercoiling coordinates gene expression with metabolism. Furthermore, this control is acting directly because we can exclude the potential role of the TRN as a mediator.


Figures

Figure 1
Figure 1
Illustration of the different components involved in E. coli transcriptional regulation, transcription and metabolism. (A) Three interconnected networks of cellular organization. Only a subset of the overall network elements is shown for the sake of clarity, i.e. only nodes and edges involved in E. coli central metabolism are depicted. (i) The transcriptional regulatory network (TRN): transcription factors (cyan cubes) control the expression of metabolic genes (gray spheres) either by activation (green links) or repression (red links). (ii) Chromosomal organization: DNA topology is affected globally by supercoiling (see B) and locally by nucleoid associated proteins (see C). (iii) Depiction of E. coli central metabolism (as described in [45]). Metabolic genes on the chromosome (ii) are connected to reactions (red spheres) according to their gene-protein/enzyme-reaction relationships. (B) Supercoiling energy changes across growth. The early growth phase is governed by high supercoiling, while the later phase is rather associated with low supercoiling. In addition, a wide range of environmental conditions can induce changes in supercoiling energy. In the experiments discussed here, the supercoiling energy has been altered chemically (see Methods), in order to mimic such physiological changes in a controlled fashion. (C) NAPs translate the global superhelical torsion into locally meaningful structures, e.g. loops (FIS) and plectonemes (H-NS).
Figure 2
Figure 2
Experimental setup. Transcript profiles, of four E. coli strains (wild type, fis mutant, hns mutant and fis/hns double mutant) are compared under low (↓σdensity) and high superhelical density (↑σdensity), leading to four sets of differential expressed genes. The shading of the schematically depicted data sets on the right-hand side (black, dark gray, gray and white) will be used throughout the article.
Figure 3
Figure 3
Effective gene networks and metabolic coherence. (A) Scheme depicting the calculation of the metabolic coherence ratio MCR for afictitious network and data set. The data (genes with significantly changed expression) are mapped onto the network resulting in an effective subnetwork. The metabolic control ratio is then the ratio of connected nodes (blue) and all nodes, i.e. the sum of connected and isolated (red) nodes, in the effective network. Unhighlighted nodes correspond to genes with no significant expression changes. (B) Calculation of the metabolic coherence. Randomly reselecting the same number of affected nodes in the network allows the sampling of random effective networks and thus the computation of a set of random metabolic control ratios MCR'. These allow the computation of a z-score value termed metabolic coherence MC for the MCR. (2) is an example of a real effective network, whereas (1) is one of its random counterparts. MCR' of (1) lies approximately around the mean <MCR' >.
Figure 4
Figure 4
MC for four independent E. coli metabolic network reconstructions. (A) The network obtained from the EcoCyc database pathway information. (B) The network obtained from the KEGG pathways. (C) The network subset of the iAF1260 network where currency metabolites have been removed manually. (D) The iAF1260 network (currency metabolites have been removed manually) consisting only of reactions active under a rich medium condition. Error bars represent the standard deviation of a jackknife test, where the MC was recomputed 100 times by discarding 10% of the transcript data for each of the four genetic backgrounds.
Figure 5
Figure 5
Results for the MC analysis for all available network reconstructions sorted by the size of the wild type MC. Notation: network* - linked reactions with an overlap in the underlying gene set have been omitted; network** - only linked reactions are included, where both are associated with single non-overlapping genes; iAF1260man - currency metabolites have been removed manually; iAF1260deg - currency metabolites have been removed by degree threshold; iAF1260 - the untreated network (KEGG and EcoCyc are per construction free of currency metabolites); in the following (k) denotes slice number k in the chart. (1) EcoCyc, (2) EcoCyc*, (3) Intersection of EcoCyc and KEGG networks, (4) Intersection of EcoCyc and iAF1260man, (5) formula image, (6) iAF1260man obtained from FBA (rich medium), (7) iAF1260man, (8) EcoCyc**, (9) KEGG*, (10) iAF1260*, (11) iAF1260deg, (12) formula image, (13) Flux-coupling network (fully coupled), (14) KEGG, (15) Intersection of KEGG and iAF1260man, (16) Intersection of EcoCyc, KEGG and iAF1260man, (17) KEGG**, (18) Flux-coupling network (fully and directionally coupled), (19) formula image, (20) iAF1260**, (21) Flux-coupling network (directionally coupled), (22) iAF1260, (23) iAF1260*.
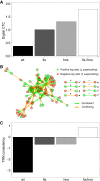
Figure 6
Figure 6
MC under varying media conditions. Starting from a rich medium, medium components are removed one by one under the condition that biomass production is not disrupted until a minimal medium composition is reached. Mean MC values over 20 simulations are shown for the wild type (blue), fis (red), hns (yellow), and fis/hns double mutant (green) effective gene network. Error bars represent the standard deviation.
Figure 7
Figure 7
TRN consistency. (A) Digital CTC (digital control) for the four genetic backgrounds. (B) The effective TRN (including only metabolic genes and their regulators) for the double mutant data (fis/hns). The scheme on the right-hand side explains the classification of consistent (checkmark; green link color) and inconsistent (x; orange link color) links. (C) Consistency of the signs of supercoiling-induced gene expression changes with the transcriptional regulatory network.

Similar articles

Cited by

References

    1. Travers A, Muskhelishvili G. DNA supercoiling - a global transcriptional regulator for enterobacterial growth? Nat Rev Microbiol. 2005;3(2):157–69. doi: 10.1038/nrmicro1088. - DOI - PubMed
    1. Muskhelishvili G, Travers A. In: RNA polymerases as molecular motors. Buc H, Strick T, editor. Cambridge, UK: RSC Publishing; 2009. Intrinsic in vivo modulators: negative supercoiling and the constituents of the bacterial nucleoid; pp. 69–95. full_text.
    1. Travers A, Muskhelishvili G. DNA microloops and microdomains: a general mechanism for transcription activation by torsional transmission. J Mol Biol. 1998;279(5):1027–43. doi: 10.1006/jmbi.1998.1834. - DOI - PubMed
    1. Hatfield GW, Benham CJ. DNA topology-mediated control of global gene expression in Escherichia coli. Annu Rev Genet. 2002;36:175–203. doi: 10.1146/annurev.genet.36.032902.111815. - DOI - PubMed
    1. Opel ML, Aeling KA, Holmes WM, Johnson RC, Benham CJ, Hatfield GW. Activation of transcription initiation from a stable RNA promoter by a Fis protein-mediated DNA structural transmission mechanism. Mol Microbiol. 2004;53(2):665–74. doi: 10.1111/j.1365-2958.2004.04147.x. - DOI - PubMed

Publication types

MeSH terms