. 2011 Apr;178(4):1835-46.
doi: 10.1016/j.ajpath.2010.12.045. Epub 2011 Mar 4.

Distinct profiles of epigenetic evolution between colorectal cancers with and without metastasis

Affiliations

Distinct profiles of epigenetic evolution between colorectal cancers with and without metastasis

Hai-Xing Ju et al. Am J Pathol. 2011 Apr.

Abstract

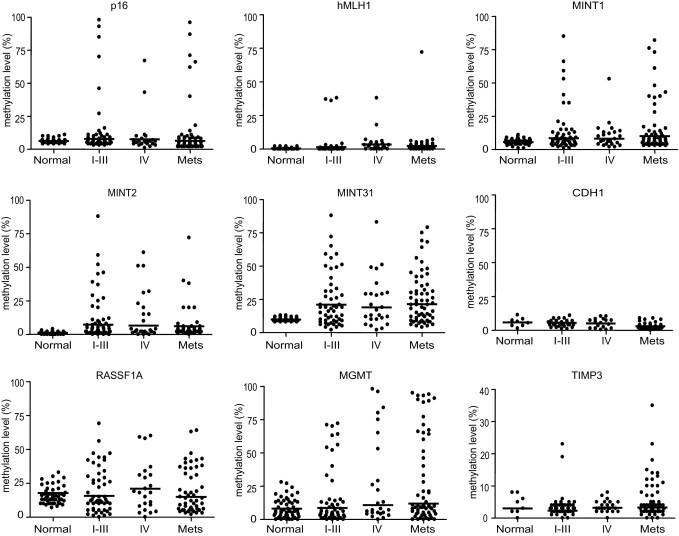
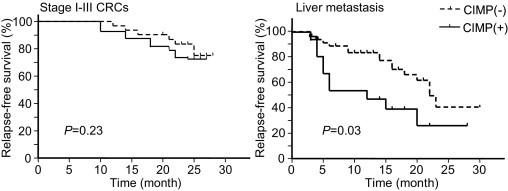
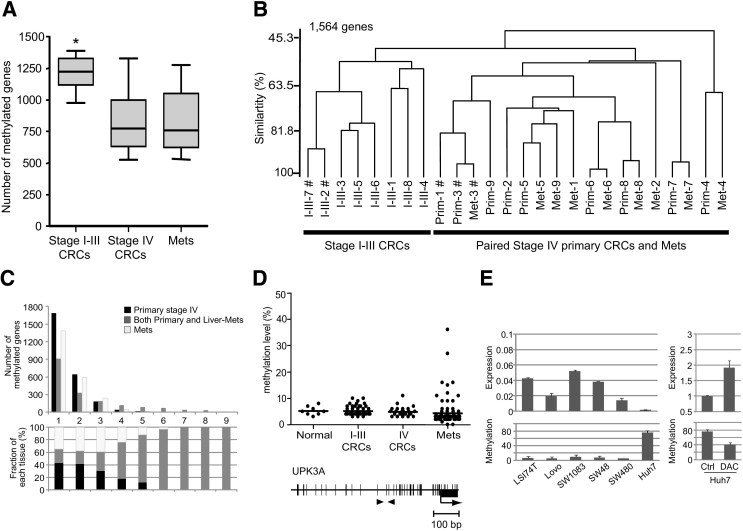
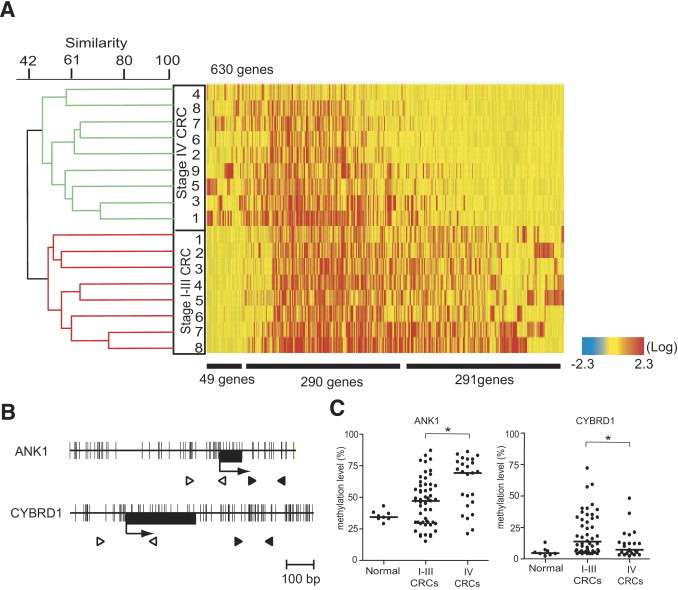
Liver metastasis is a fatal step in the progression of colorectal cancer (CRC); however, the epigenetic evolution of this process is largely unknown. To decipher the epigenetic alterations during the development of liver metastasis, the DNA methylation status of 12 genes, including 5 classical CpG island methylator phenotype (CIMP) markers, was analyzed in 62 liver metastases and in 78 primary CRCs (53 stage I-III; 25 stage IV). Genome-wide methylation analysis was also performed in stage I-III CRCs and in paired primary and liver metastatic cancers. Methylation frequencies of MGMT and TIMP3 increased progressively from stage I-III CRCs to liver metastasis (P = 0.043 and P = 0.028, respectively). The CIMP-positive cases showed significantly earlier recurrence of disease than did CIMP-negative cases with liver metastasis (P = 0.030), whereas no such difference was found in stage I-III CRCs. Genome-wide analysis revealed that more genes were methylated in stage I-III CRCs than in paired stage IV samples (P = 0.008). Hierarchical cluster analysis showed that stage I-III CRCs and stage IV CRCs were clustered into two distinct subgroups, whereas most paired primary and metastatic cancers showed similar methylation profiles. This analysis revealed distinct methylation profiles between stage I-III CRCs and stage IV CRCs, which may reflect differences in epigenetic evolution during progression of the disease. In addition, most methylation status in stage IV CRCs seems to be established before metastasis.


Figures

Figure 1
Figure 1
DNA methylation status of nine genes (p16, hMLH1, MINT1, MINT2, MINT31, CDH1, RASSF1A, MGMT, and TIMP3) in 53 stage I–III CRCs (I–III), 25 stage IV CRCs (IV), and 62 liver metastases (Mets) and corresponding normal colonic mucosae. The y axis indicates the level of DNA methylation of each gene, as measured by bisulfite pyrosequencing–based methylation analysis. Each dot represents the methylation level of the indicated gene in each sample from either primary CRCs of a differing stage or liver metastases. Horizontal lines denote median methylation levels in each group.
Figure 2
Figure 2
Kaplan-Meier analyses of the probability of RFS in patients with stage I–III CRCs or liver metastases. Both CIMP-negative (n = 31 stage I–III CRCs; n = 47 liver metastases) and CIMP-positive (n = 11 stage I–III CRCs; n = 15 liver metastases) tumors are shown.
Figure 3
Figure 3
The MCAM analysis in stage I–III CRCs and paired stage IV CRCs and liver metastases. A: Box and whisker analysis of the number of methylated genes in stage I–III CRCs and in paired stage IV CRCs and liver metastases (Mets). The median is marked by a bold line inside the box, whose ends denote the upper and lower quartiles. Error bars represent 5 and 95 percentile values. DNA methylation levels were statistically analyzed between stage I–III CRCs, stage IV CRCs, and liver metastases. *P = 0.008. B: Dendrogram overview of unsupervised hierarchical cluster analysis using DNA methylation data from 1564 genes assessed via MCAM analysis. I–III, Prim, and Met followed by a number indicate each case of stage I–III CRC, stage IV primary CRC, and liver metastasis, respectively; #, CIMP-positive tumor. C: Number of genes (y axis) that were commonly methylated in x number of cases, where x is the axis in stage IV primary tumor (black), liver metastasis (white), or both primary and liver metastasis (gray) (top), and the fraction of each tissue that has commonly methylated genes in x number of cases (bottom). D: DNA methylation status of the UPK3A gene in 53 stage I–III CRCs, 25 stage IV CRCs, and 62 liver metastases (top) and a schematic diagram of the promoter of the UPK3A gene (bottom). The transcription start site (arrow) and the location of exon 1 (black box) are indicated. Black arrowheads indicate the regions analyzed by pyrosequencing. Scatterplot represents the same as in Figure 1. E: Gene expression (top left) and DNA methylation (bottom left) of UPK3A were measured by quantitative PCR and pyrosequencing analysis in six cell lines, respectively. After treatment with 5-aza-2′-deoxycytidine (1 μmol/L), UPK3A was reactivated (top right) with a decreased level of DNA methylation (top right). Ctrl, cells treated with distilled water. Relative values of mRNA expression for the UPK3A gene to glyceraldehyde-3-phosphate dehydrogenase are shown on the y axis (top). Error bars denote SDs from experiments in triplicate.
Figure 4
Figure 4
Dendrogram and heat map overview of unsupervised hierarchical cluster analysis of DNA methylation data from stage I–III CRCs and stage IV CRCs using 630 genes. A: Commonly methylated genes in either stage I–III CRCs or stage IV CRCs are analyzed. Each cell in the matrix represents the DNA methylation status of a gene in an individual sample. Red and blue in cells reflect high and low methylation levels, respectively, as indicated in the scale bar (log2-transformed scale). Numbers below the matrix indicate the methylated genes frequently found in stage IV CRCs, in both stage I–III CRCs and stage IV CRCs, and in stage I–III CRCs, respectively. The dendrogram represents the same as Figure 3. B: Schematic diagrams of the promoters of the ANK1 and CYBRD1 genes. The transcription start site (arrow) and the location of exon 1 (black box) are indicated. Black and white arrowheads indicate the regions analyzed by pyrosequencing and MSP, respectively. C: DNA methylation status of the ANK1 and CYBRD1 genes in 8 normal tissues, 53 stage I–III CRCs, and 25 stage IV CRCs. Scatterplot represents the same as Figure 1. DNA methylation levels were statistically analyzed between stage I–III CRCs and stage IV CRCs. *P < 0.05.

References

    1. Jemal A., Siegel R., Ward E., Hao Y., Xu J., Murray T., Thun M.J. Cancer statistics, 2008. CA Cancer J Clin. 2008;58:71–96. - PubMed
    1. Scheele J., Stang R., Altendorf-Hofmann A., Paul M. Resection of colorectal liver metastases. World J Surg. 1995;19:59–71. - PubMed
    1. Mayo S.C., Pawlik T.M. Current management of colorectal hepatic metastasis. Expert Rev Gastroenterol Hepatol. 2009;3:131–144. - PubMed
    1. Taylor M., Forster J., Langer B., Taylor B.R., Greig P.D., Mahut C. A study of prognostic factors for hepatic resection for colorectal metastases. Am J Surg. 1997;173:467–471. - PubMed
    1. Nikfarjam M., Shereef S., Kimchi E.T., Gusani N.J., Jiang Y., Avella D.M., Mahraj R.P., Staveley-O'Carroll K.F. Survival outcomes of patients with colorectal liver metastases following hepatic resection or ablation in the era of effective chemotherapy. Ann Surg Oncol. 2009;16:1860–1867. - PubMed