. 2011 Mar 15;71(6):2183-92.
doi: 10.1158/0008-5472.CAN-10-3626.

CARMA3 is crucial for EGFR-Induced activation of NF-κB and tumor progression

Affiliations

CARMA3 is crucial for EGFR-Induced activation of NF-κB and tumor progression

Tang Jiang et al. Cancer Res. .

Abstract

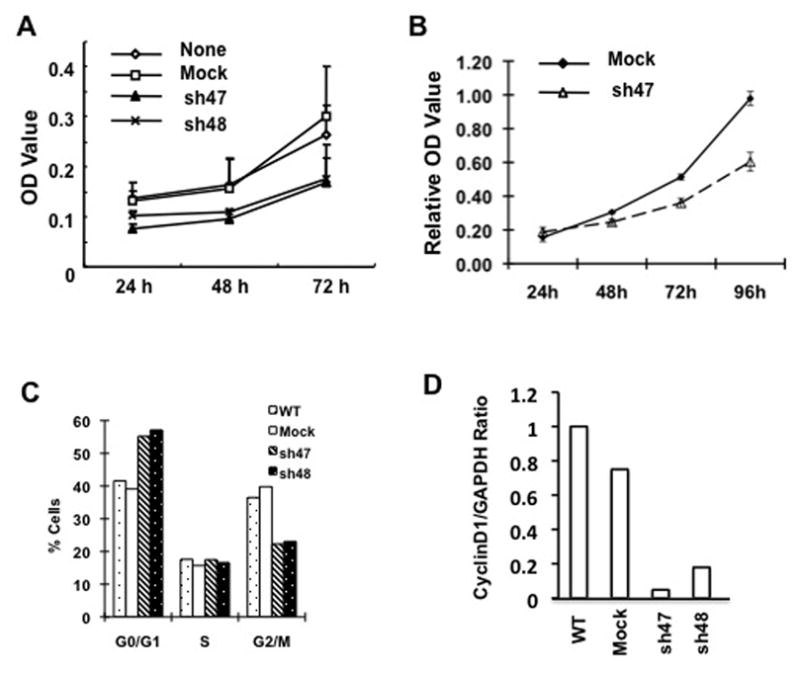
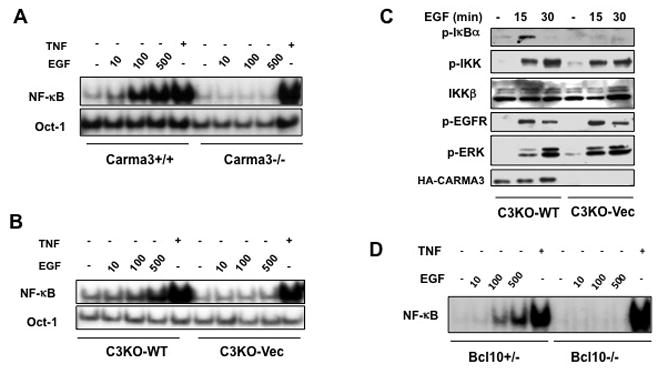
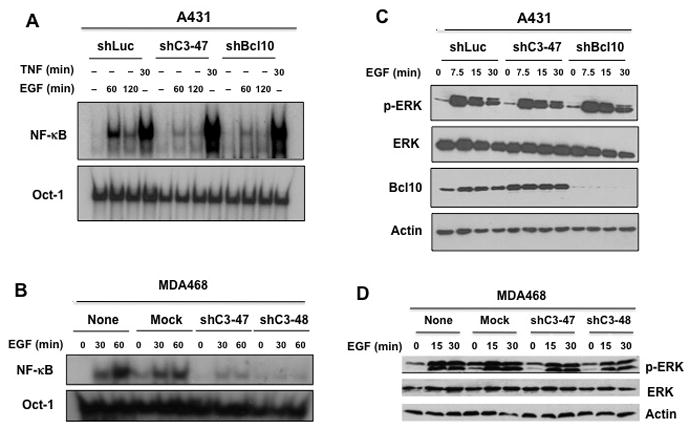
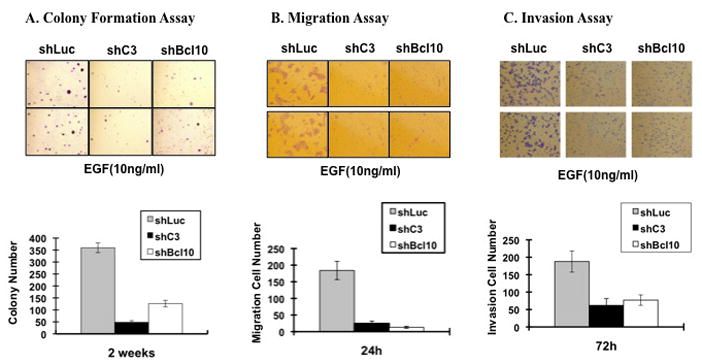
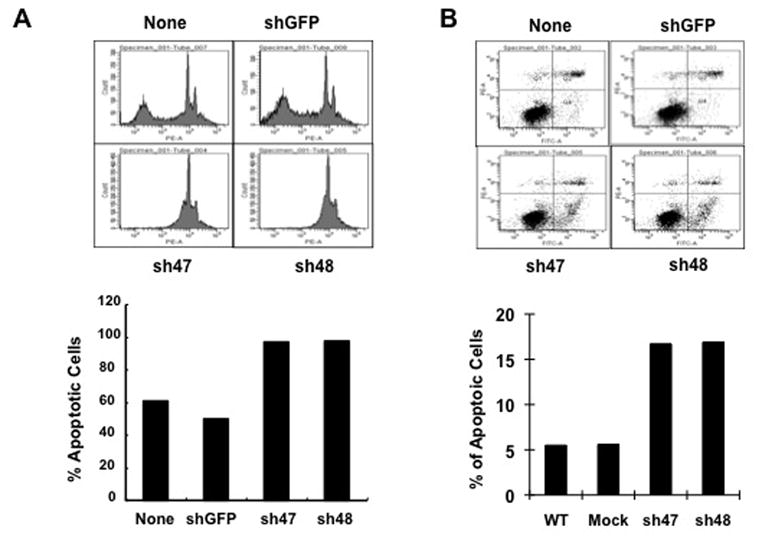
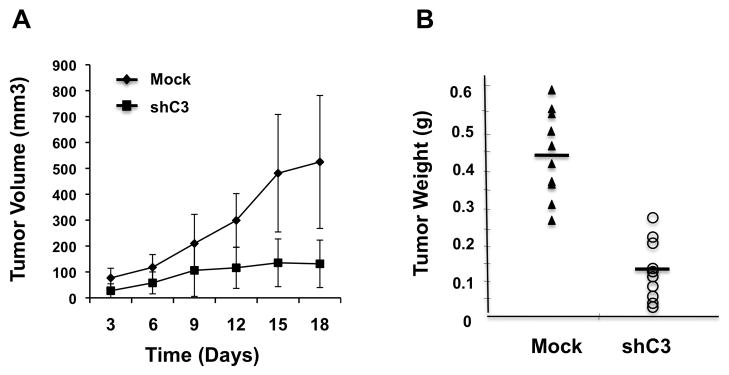
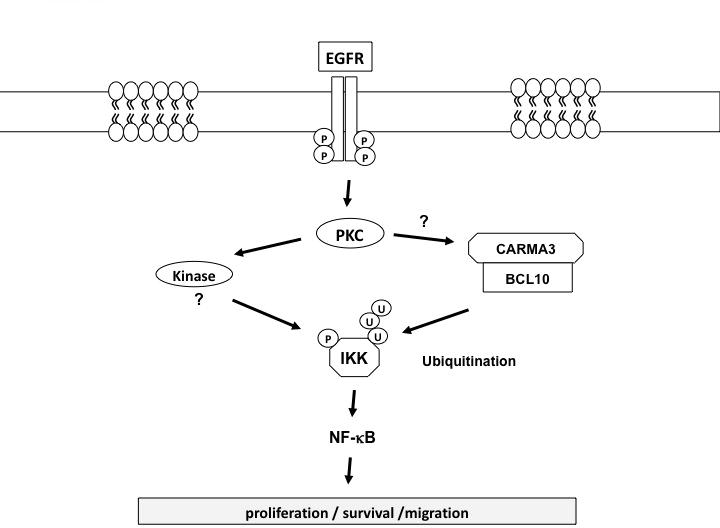
EGF activates NF-κB, and constitutively activated NF-κB contributes to EGFR mutation-associated tumorigenesis, but it remains unclear precisely how EGFR signaling leads to NF-κB activation. Here we report that CARMA3, a caspase recruitment domain (CARD)-containing scaffold molecule, is required for EGF-induced NF-κB activation. CARMA3 deficiency impaired the activation of the IKK complex following EGF stimulation, resulting in a defect of EGF-induced IκBα phosphorylation and NF-κB activation. We found that CARMA3 and Bcl10 contributed to several characteristics of EGFR-associated malignancy, including proliferation, survival, migration, and invasion. Most importantly, CARMA3 contributed to tumor growth in vivo. Our findings elucidate a crucial link between EGFR-proximal signaling components and the downstream IKK complex, and they suggest a new therapeutic target for treatment of EGFR-driven cancers.


Figures

Figure 1
Figure 1. CARMA3 deficiency affects cell cycle and cancer cell growth
(A) MDA-468 cells with stably expressing CARMA3 shRNA (sh47 and sh48) or negative control (GFP) were seeded in 96-well plates. Cell proliferation was examined at 24, 48, and 72 hours, respectively, by the MTT assay. The absorbance at 570 nm at different time points was determined. The experiment was repeated for three times, and the result from one of these experiments is presented. (B) MTT assay was similarly performed to examine the growth rate of A431 cells with CARMA3 shRNA (sh47) or mock control. (C) Above MDA cells were grown in DMEM complete media for overnight. The cells were harvested, fixed, and subjected to Propidium Iodide (PI) staining for cell cycle analysis by FACS. Data from different cell cycle phase was presented as percentage of cells (**P<0.01, *p>0.05). (D) Real-time PCR were performed to detect the expression level of Cyclin D1 using total RNA were prepared from MDA468 cells (WT), or MDA468 cells transduced with control shRNA for GFP (Mock) or CARMA3 shRNA (sh47 and sh48). The expression level of GAPDH was used as internal controls.
Figure 2
Figure 2. CARMA3 is required for EGF-induced NF-κB activation
(A) MEF cells from Carma3+/+ or Carma3−/− mice were stimulated with indicated doses of EGF (μM) or TNFα (10 ng/ml). (B) CARMA3-knockout cells were reconstituted with wild type CARMA3 (C3KO-WT) or vector control (C3KO-Vec) were stimulated with indicated doses of EGF or TNFα (10 ng/ml). Nuclear extracts were prepared and then subjected to EMSA using 32P-labeled NF-κB or Oct-1 probe. (D) C3KO-WT or C3KO-Vec cells were stimulated with EGF (100 μM) for indicated time and then cell lysates were subjected to immunoblotting analysis using indicated antibodies. (C) C3KO-WT or C3KO-Vec cells were stimulated with EGF (100 μM) or TNFα (10 ng/ml) for indicated time. Cell lysates were subjected to immunoblotting analysis using indicated antibodies. (D) MEF cells from Bcl10+/− or Bcl10−/− mice were stimulated with indicated concentration of EGF (μM) or TNFα (10 ng/ml) for one hour. Nuclear extracts were prepared from these cells, and then subjected to EMSA using 32P-labeled NF-κB probe.
Figure 3
Figure 3. CARMA3 and Bcl10 mediate EGF-induced NF-κB activation in cancer cells
(A) A431 cells transduced with shRNA for luciferase (shLuc), for CARMA3 (shC3), and for Bcl10 (shBcl10) were stimulated with or without 10 ng/ml of EGF or 10 ng/ml of TNFα for indicated times. (B) MDA468 cells (None) or MDA468 cells transduced with control shRNA for GFP (Mock) or with CARMA3 shRNA (shC3-47 and shC3-48) were stimulated with EGF (10 ng/ml) for 0, 30, and 60 minutes. Nuclear extracts were prepared from cells in (A) or (B), and then subjected to EMSA using 32P-labeled NF-κB or Oct-1 probe. (C) A431 cells in (A) were stimulated with EGF (10 ng/ml) for 0, 7.5, 15, and 30 minutes. Total cell lysates were prepared from these cells and then subjected to immunoblotting analysis with indicated antibodies. (D) MDA468 cells in (B) were stimulated with 10 ng/ml of EGF for 0, 15, or 30 minutes. Total cell lysates were prepared from these cells and then subjected to immunoblotting analysis with indicated antibodies.
Figure 4
Figure 4. CARMA3 deficiency affects the characteristics of cancer cells
(A) A431 cells transduced with shRNA for control (shLuc), CARMA3 (shC3), or Bcl10 (shBcl10) were subjected to colony formation assay in the present of 10 ng/ml of EGF for two weeks. Two fields per plate were photographed and presented (Upper panels). The bar graph indicates the mean and differences among the groups in colony number, and the standard deviation was calculated from the average of colony numbers in 3 different plates (Lower panels). (B) Above cells were seeded in the upper chamber of Transwell Boyden Chamber, and then 10 ng/ml of EGF were added in the lower chamber to allow them migrating for 24 hours. After staining, random 5 fields were photographed, and 2 of them were presented (Upper panels). The bar graph indicates the mean and difference cell numbers among the photographs, and the standard derivation was calculated from the average of cells in the 5 fields (Lower panels). (C) Above cells were seeded in the upper chamber of Transwell Boyden Chamber with matrix-gel, and then 10 ng/ml of EGF were added in the lower chamber to allow them migrating for 72 hours. After staining, random 5 fields were photographed, and 2 of them were presented (Upper panels). The bar graph indicates the mean and difference cell numbers among the photographs, and the standard derivation was calculated from the average of cells in the 5 fields (Lower panels). All of these experiments were repeated for three times and similar results were obtained.
Figure 5
Figure 5. CARMA3 is required for resistance for 5-FU-induced cell death
MDA468 cells, without transducing shRNA (None) or with transducing GFP shRNA (mock) or CARMA3 shRNA (sh47 and sh48), were seeded at equal density, grown to sub-confluence, starved, and incubated with EGF (100 μM) for overnight. These cells were then trypsinized, and then cultured in single cell suspensions in 2-hydroxyethyl methacrylate-coated flasks for 24 hours. Cells were harvested, fixed, stained with Annexin V staining, and subjected to FACS analysis (Upper panels). The percentage of Annexin V-positive cells was plotted into the bar graph (Lower panel). (B) Above cells were starved in serum-free media and stimulated with 20 ug/ml of 5-FU and 100 ng/ml of EGF for 48 hours, and then stained with PE-conjugated PI and FITC-labeled Annexin V. The resulted cells were subjected to FACS for apoptosis analysis. The early apoptosis cells (Annexin V-positive Q4 cells) were plotted into the bar graph. These experiments were repeated for three times, and similar results were obtained.
Figure 6
Figure 6. Suppressing CARMA3 expression inhibits tumor xenografts in nude mice
(A) A431 cells with control GFP shRNA (mock) or CARMA3 shRNA (shC3) were subcutaneously on each side of male nude mice to develop xenograft tumors. Tumor volume (mm3) was determined twice weekly and plotted against time (days), expressed as mean ± SE (P<0.01). (B) Tumor weight (g) was measured at the end of this study, expressed as mean ± SE (P<0.01).
Figure 7
Figure 7. Working model for EGFR-induced NF-κB activation

References

    1. Hayden MS, Ghosh S. Shared principles in NF-kappaB signaling. Cell. 2008;132:344–62. - PubMed
    1. Baldwin AS. Control of oncogenesis and cancer therapy resistance by the transcription factor NF-kappaB. J Clin Invest. 2001;107:241–6. - PMC - PubMed
    1. Karin M. Nuclear factor-kappaB in cancer development and progression. Nature. 2006;441:431–6. - PubMed
    1. Naugler WE, Karin M. NF-kappaB and cancer-identifying targets and mechanisms. Curr Opin Genet Dev. 2008;18:19–26. - PMC - PubMed
    1. Hanahan D, Weinberg RA. The hallmarks of cancer. Cell. 2000;100:57–70. - PubMed

Publication types

MeSH terms