

Genetic analysis of complex traits in the emerging Collaborative Cross
- PMID: 21406540
- PMCID: PMC3149489
- DOI: 10.1101/gr.111310.110
Genetic analysis of complex traits in the emerging Collaborative Cross
Abstract
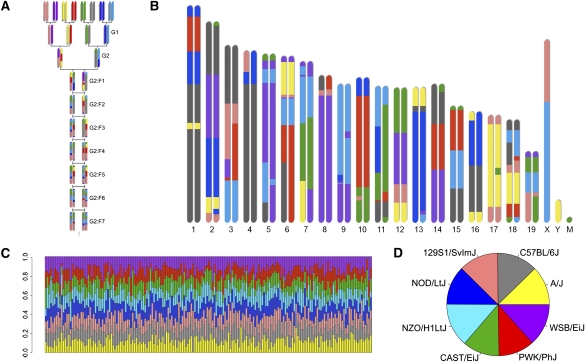
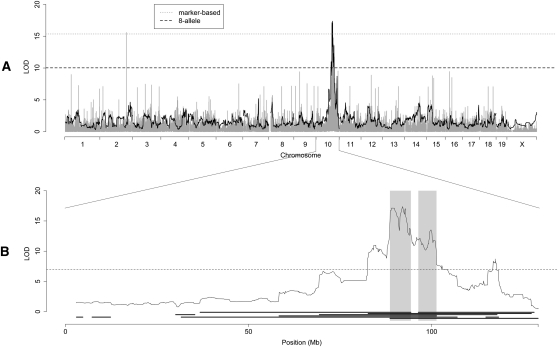
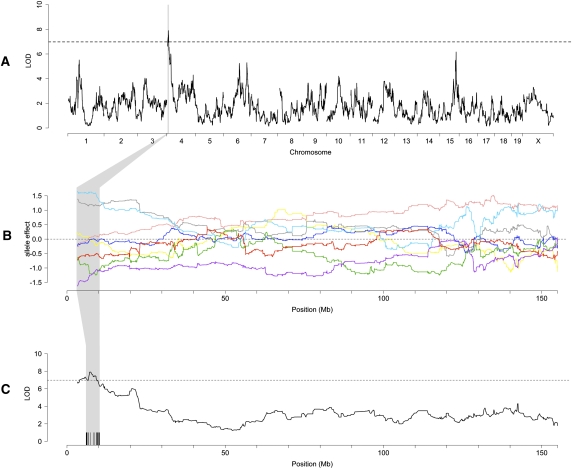
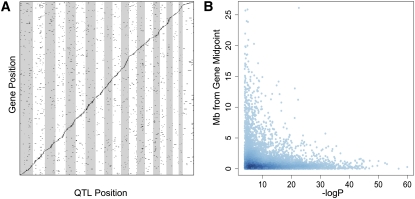
The Collaborative Cross (CC) is a mouse recombinant inbred strain panel that is being developed as a resource for mammalian systems genetics. Here we describe an experiment that uses partially inbred CC lines to evaluate the genetic properties and utility of this emerging resource. Genome-wide analysis of the incipient strains reveals high genetic diversity, balanced allele frequencies, and dense, evenly distributed recombination sites-all ideal qualities for a systems genetics resource. We map discrete, complex, and biomolecular traits and contrast two quantitative trait locus (QTL) mapping approaches. Analysis based on inferred haplotypes improves power, reduces false discovery, and provides information to identify and prioritize candidate genes that is unique to multifounder crosses like the CC. The number of expression QTLs discovered here exceeds all previous efforts at eQTL mapping in mice, and we map local eQTL at 1-Mb resolution. We demonstrate that the genetic diversity of the CC, which derives from random mixing of eight founder strains, results in high phenotypic diversity and enhances our ability to map causative loci underlying complex disease-related traits.
Figures

References
-
- Belknap JK 1998. Effect of within-strain sample size on QTL detection and mapping using recombinant inbred mouse strains. Behav Genet 28: 29–38 - PubMed
Publication types
MeSH terms
Associated data
- Actions
Grants and funding
- U54 AI081680/AI/NIAID NIH HHS/United States
- GM070683/GM/NIGMS NIH HHS/United States
- T32 GM067553/GM/NIGMS NIH HHS/United States
- T32MH076694/MH/NIMH NIH HHS/United States
- P50 MH090338/MH/NIMH NIH HHS/United States
- F32 GM090667/GM/NIGMS NIH HHS/United States
- U01 CA105417/CA/NCI NIH HHS/United States
- P30 DK056350/DK/NIDDK NIH HHS/United States
- T32GM07092/GM/NIGMS NIH HHS/United States
- R01 GM074244/GM/NIGMS NIH HHS/United States
- DK056350)/DK/NIDDK NIH HHS/United States
- GM076468/GM/NIGMS NIH HHS/United States
- MH090338/MH/NIMH NIH HHS/United States
- DK076050/DK/NIDDK NIH HHS/United States
- U01 CA134240/CA/NCI NIH HHS/United States
- U01CA105417/CA/NCI NIH HHS/United States
- F32GM090667/GM/NIGMS NIH HHS/United States
- U01CA134240/CA/NCI NIH HHS/United States
- GM067553/GM/NIGMS NIH HHS/United States
- 090532/Wellcome Trust/United Kingdom
- GM074244/GM/NIGMS NIH HHS/United States
- T32 MH076694/MH/NIMH NIH HHS/United States
- R01 DK076050/DK/NIDDK NIH HHS/United States
- T32 GM007092/GM/NIGMS NIH HHS/United States
- P50 GM076468/GM/NIGMS NIH HHS/United States
- R01 GM070683/GM/NIGMS NIH HHS/United States
LinkOut - more resources
Full Text Sources
Molecular Biology Databases
Miscellaneous