. 2011 Jun;300(6):E1076-84.
doi: 10.1152/ajpendo.00531.2010. Epub 2011 Mar 15.

Dietary manipulation reveals an unexpected inverse relationship between fat mass and adipose 11β-hydroxysteroid dehydrogenase type 1

Affiliations

Dietary manipulation reveals an unexpected inverse relationship between fat mass and adipose 11β-hydroxysteroid dehydrogenase type 1

Tak Yung Man et al. Am J Physiol Endocrinol Metab. 2011 Jun.

Abstract

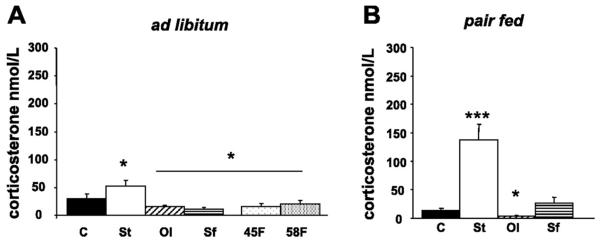
Increased dietary fat intake is associated with obesity, insulin resistance, and metabolic disease. In transgenic mice, adipose tissue-specific overexpression of the glucocorticoid-amplifying enzyme 11β-hydroxysteroid dehydrogenase type 1 (11β-HSD1) exacerbates high-fat (HF) diet-induced visceral obesity and diabetes, whereas 11β-HSD1 gene knockout ameliorates this, favoring accumulation of fat in nonvisceral depots. Paradoxically, in normal mice HF diet-induced obesity (DIO) is associated with marked downregulation of adipose tissue 11β-HSD1 levels. To identify the specific dietary fats that regulate adipose 11β-HSD1 and thereby impact upon metabolic disease, we either fed mice diets enriched (45% calories as fat) in saturated (stearate), monounsaturated (oleate), or polyunsaturated (safflower oil) fats ad libitum or we pair fed them a low-fat (11%) control diet for 4 wk. Adipose and liver mass and glucocorticoid receptor and 11β-HSD1 mRNA and activity levels were determined. Stearate caused weight loss and hypoinsulinemia, partly due to malabsorption, and this markedly increased plasma corticosterone levels and adipose 11β-HSD1 activity. Oleate induced pronounced weight gain and hyperinsulinemia in association with markedly low plasma corticosterone and adipose 11β-HSD1 activity. Weight gain and hyperinsulinemia was less pronounced with safflower compared with oleate despite comparable suppression of plasma corticosterone and adipose 11β-HSD1. However, with pair feeding, safflower caused a selective reduction in visceral fat mass and relative insulin sensitization without affecting plasma corticosterone or adipose 11β-HSD1. The dynamic depot-selective relationship between adipose 11β-HSD1 and fat mass strongly implicates a dominant physiological role for local tissue glucocorticoid reactivation in fat mobilization.


Figures

Fig. 1
Fig. 1
The effects of dietary fat enrichment on food intake, weight gain, and glucose homeostasis. A: weight gain (left) and total calorie intake (right) after 4-wk ad libitum feeding with control (black bars), stearate (open bars), oleate (diagonal hatched bars), safflower oil (horizontal striped bars), 45HF (45% calories as fat; lightly stippled bars), and 58HF (58% calories as fat; heavily stippled bars) diets. B: changes in subcutaneous (sc) and mesenteric (MES) adipose and liver following dietary enrichment, as in A. C: linear regression of fasting insulin and combined fat mass [sc and MES, corrected for body weight (BW)] in all ad libitum-fed groups. D: fasting glucose/insulin ratio after ad libitum feeding of diets. Diagonal dashed lines represent significance boundaries relative by distance from the control diet mean values (■). Symbol infills indicate the same diets as the bar infills from the ad libitum-(A and B) and pair-fed (E and F) studies, respectively, and represent stearate (□), oleate (diagonal hatched diamond), safflower oil (horizontal striped circle), 45HF (lightly stippled circle), and 58HF (heavily stippled diamond). E: weight gain after 4 wk of pair-feeding of the control and single fatty acid-enriched diets. F: changes in fat depot and liver weight after pair-feeding of diets as in C. G: morning glucose/insulin levels after pair-feeding of control and single fatty acid-enriched diets. Vertical dashed lines represent significance boundaries relative by distance from the control diet mean values (■). Symbols represent stearate (□), oleate (diagonal hatched diamond), and safflower (horizontal striped circle). Data are means ± SE; n = 6/group. *P < 0.05, **P < 0.01, ***P < 0.001, significantly different from control diet. Note that the reduction in fat mass in the stearate groups is highly significant in all white fat depots, but annotation has been omitted from the graph for clarity.
Fig. 2
Fig. 2
The effects of dietary fat enrichment on circulating corticosterone levels. A: corticosterone levels after 4-wk ad libitum feeding with control (black bars), stearate (open bars), oleate (hatched bars), safflower oil (horizontal striped bars), 45HF (lightly stippled bars), and 58HF (heavily stippled bars) diets. B: corticosterone after 4 wk of pair-feeding of the control and single fatty acid-enriched diets. *P < 0.05, ***P < 0.001, significantly different from control diet.
Fig. 3
Fig. 3
The effects of dietary fat enrichment on adipose 11β-hydroxysteroid dehydrogenase type 1 (11β-HSD1) mRNA and activity levels. Adipose 11β-HSD1 mRNA (A and C) and activity levels (B and D) in sc (A and B) and MES (C and D) adipose tissues after 4-wk ad libitum feeding with control (black bars), stearate (open bars), oleate (hatched bars), safflower oil (horizontal striped bars), 45HF (lightly stippled bars), and 58HF (heavily stippled bars) diets. Data are means ± SE; n = 6/group. *P < 0.05, **P < 0.01, ***P < 0.001, significantly different from control diet.
Fig. 4
Fig. 4
The effects of dietary fat enrichment with pair-feeding on adipose 11β-HSD1 mRNA and activity levels. Adipose 11β-HSD1 mRNA (A and C) and activity levels (B and D) in sc (A and B) and MES (C and D) adipose tissues after 4 wk of pair-feeding control (black bars), stearate (white bars), oleate (hatched bars), and safflower oil (horizontal striped bars) diets. Data are means ± SE; n = 6/group. *P < 0.05, **P < 0.01, significantly different from control diet.
Fig. 5
Fig. 5
The effects of short-term (1 wk) stearate-enriched or 45HF diet on adipose 11β-HSD1 activity levels. A: sc adipose tissue 11β-HSD1 activity after 1 wk of control (black bars), stearate (open bars), or 45HF (lightly stippled bars). B: MES adipose tissue 11β-HSD1 activity after 1 wk of control (black bars), stearate (open bars), or 45HF (lightly stippled bars). Data are means ± SE; n = 6/group. *P < 0.05, **P < 0.01, significantly different from control diet.
Fig. 6
Fig. 6
The effects of dietary fat enrichment on hepatic 11β-HSD1 mRNA and activity levels. A: liver 11β-HSD1 mRNA. B: activity levels after 4-wk ad libitum feeding with control (black bars), stearate (open bars), oleate (hatched bars), safflower oil (horizontal striped bars), 45HF (lightly stippled bars), and 58HF (heavily stippled bars) diets. Data are means ± SE; n = 6/group. **P < 0.01, significantly different from control diet.

Similar articles

Cited by

References

    1. Arner P. Differences in lipolysis between human subcutaneous and omental adipose tissues. Ann Med. 1995;27:435–438. - PubMed
    1. Balachandran A, Guan H, Sellan M, van Uum S, Yang K. Insulin and dexamethasone dynamically regulate adipocyte 11beta-hydroxysteroid dehydrogenase type 1. Endocrinology. 2008;149:4069–4079. - PMC - PubMed
    1. Berthiaume M, Laplante M, Festuccia W, Gélinas Y, Poulin S, Lalonde J, Joanisse DR, Thieringer R, Deshaies Y. Depot-specific modulation of rat intraabdominal adipose tissue lipid metabolism by pharmacological inhibition of 11beta-hydroxysteroid dehydrogenase type 1. Endocrinology. 2007;148:2391–2397. - PubMed
    1. Brown MS, Goldstein JL. Selective versus total insulin resistance: a pathogenic paradox. Cell Metab. 2008;7:95–96. - PubMed
    1. Bujalska IJ, Hewitt KN, Hauton D, Lavery GG, Tomlinson JW, Walker EA, Stewart PM. Lack of hexose-6-phosphate dehydrogenase impairs lipid mobilization from mouse adipose tissue. Endocrinology. 2008;149:2584–2591. - PMC - PubMed

Publication types

MeSH terms