. 2011 Mar;23(3):1093-106.
doi: 10.1105/tpc.110.082420. Epub 2011 Mar 15.

Arabidopsis kinesin KP1 specifically interacts with VDAC3, a mitochondrial protein, and regulates respiration during seed germination at low temperature

Affiliations

Arabidopsis kinesin KP1 specifically interacts with VDAC3, a mitochondrial protein, and regulates respiration during seed germination at low temperature

Xue-Yong Yang et al. Plant Cell. 2011 Mar.

Abstract

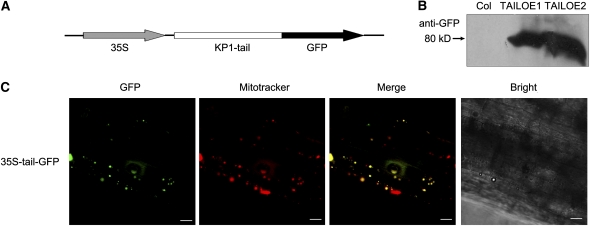
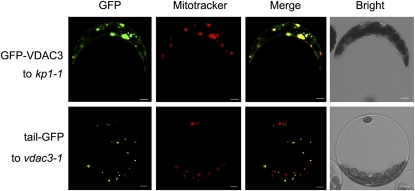
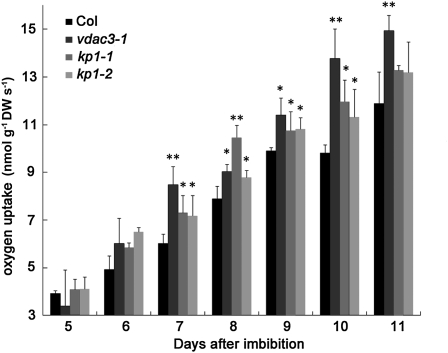
The involvement of cytoskeleton-related proteins in regulating mitochondrial respiration has been revealed in mammalian cells. However, it is unclear if there is a relationship between the microtubule-based motor protein kinesin and mitochondrial respiration. In this research, we demonstrate that a plant-specific kinesin, Kinesin-like protein 1 (KP1; At KIN14 h), is involved in respiratory regulation during seed germination at a low temperature. Using in vitro biochemical methods and in vivo transgenic cell observations, we demonstrate that KP1 is able to localize to mitochondria via its tail domain (C terminus) and specifically interacts with a mitochondrial outer membrane protein, voltage-dependent anion channel 3 (VDAC3). Targeting of the KP1-tail to mitochondria is dependent on the presence of VDAC3. When grown at 4° C, KP1 dominant-negative mutants (TAILOEs) and vdac3 mutants exhibited a higher seed germination frequency. All germinating seeds of the kp1 and vdac3 mutants had increased oxygen consumption; the respiration balance between the cytochrome pathway and the alternative oxidase pathway was disrupted, and the ATP level was reduced. We conclude that the plant-specific kinesin, KP1, specifically interacts with VDAC3 on the mitochondrial outer membrane and that both KP1 and VDAC3 regulate aerobic respiration during seed germination at low temperature.


Figures

Figure 1.
Figure 1.
The Tail Domain Is Responsible for Mitochondrial Targeting of KP1 in Arabidopsis Protoplasts. (A) GFP fusion constructs of KP1 and its truncated variants (GFP-Δtail and tail-GFP). The domains of KP1 are indicated by head (head domain; 1 to 374 amino acids), motor (motor domain; 375 to 748 amino acids), and tail (tail domain; 749 to 1087 amino acids). (B) Immunofluorescence labeling of microtubules and microfilaments in Arabidopsis suspension cell protoplasts transiently overexpressing GFP-KP1. For microtubule labeling, anti-α-tubulin antibody and tetramethylrhodamine β-isothiocyanate–conjugated goat anti-mouse IgG were used. For microfilaments, rhodamine-phalloidin was used. Bars = 5 μm. (C) KP1 fusion proteins in suspension cell protoplasts are able to localize to mitochondria via their tail domain. From left to right, green channel (GFP), red channel (MitoTracker, mitochondria selective reagent), merged images of green and red channel (Merge), and transmission images (Bright). Bars = 5 μm.
Figure 2.
Figure 2.
Mitochondrial Localization and Immunoblotting Test of KP1-Tail in Stem. (A) The diagram represents the transgenic construct used to overexpress KP1-tail-GFP. GFP was fused to the tail domain of KP1. (B) Immunoblot identification of tail-GFP in Col, TAILOE1, and TAILOE2 using anti-GFP antibody (1:10,000). Molecular marker is indicated in kilodaltons in the left margin. (C) KP1-tail-GFP in the stem of transgenic seedlings colocalized with mitochondria. From left to right, green channel (GFP), red channel (MitoTracker, mitochondria selective reagent), merged images of green and red channel (Merge), and transmission images (Bright). Bars = 20 μm.
Figure 3.
Figure 3.
Identification and Verification of a KP1-Interacting Protein, VDAC3. (A) Yeast two-hybrid assay to analyze the interaction between KP1, KP1-N (1 to 373 amino acids), KP1-M (374 to 748 amino acids), KP1-tail (749 to 1087 amino acids), and KP1-tail200 (888 to 1087 amino acids) and VDAC3 on 4D agar medium (-Trp, -Leu, -His, -Ade). Only KP1-tail and KP1-tail200 show binding activity with VDAC3. (B) Yeast two-hybrid assay to analyze the interaction between four VDAC isoforms from Arabidopsis and KP1-tail and KP1-tail200. KP1-tail and KP1-tail200 specifically interact with VDAC3. (C) GST pull-down assay. GST (27 kD) or GST-VDAC3 (60 kD) protein was bound to beads and then incubated with 6×His-tagged KP1-tail200 proteins (30 kD). The eluted proteins were separated by SDS-PAGE. Anti-KP1 (1:5000) and anti-GST (1:100,000) antibodies were used for immunoblotting. (D) Far-protein gel blot to verify the interaction between His-VDAC3 and His-KP1-tail200. Lane 1, unrelated His-tagged recombinant protein as negative control; lane 2, purified His-VDAC3 (30 kD); lane 3, total extracts from Escherichia coli expressing His-VDAC3; lane 4, purified His-KP1-tail200 (30 kD). The SDS-PAGE gel was stained with Coomassie blue and transformed onto PVDF membranes. The far-protein gel blot was performed with anti-KP1 antibody (1:5000) after the membrane was incubated with His-KP1-tail200. Two immunoblots were performed as positive controls with anti-KP1 (1:5000) and anti-VDAC3 (1:5000) antibodies, respectively, to confirm the recombinant proteins. Molecular markers are indicated in kilodaltons in the left margin. (E) Far-protein gel blot for the interaction assay between GST-VDAC3 and His-KP1-tail200. Lanes 1’ and 2’, the total extracts from E. coli expressing GST and GST-VDAC3, respectively; lane 3′, purified His-KP1-tail200. The far-protein gel blot was performed with an anti-His tag monoclonal antibody after the membrane was incubated with His-KP1-tail200. Two immunoblots were performed as positive controls with anti-His (1:10,000) and anti-VDAC3 (1:5000) antibodies, respectively, to confirm the recombinant proteins. Molecular markers are indicated in kilodaltons in the left margin.
Figure 4.
Figure 4.
KP1 Interacts with VDAC3 in Vivo. (A) BiFC assay. In Arabidopsis mesophyll protoplasts transformed with the construct pairs KP1-YFPN plus YFPC-VDAC3 or KP1-tail-YFPN plus YFPC-VDAC3, a YFP fluorescence signal was detected. For protoplasts transformed with the construct pairs KP1-tail-YFPN plus YFPC or YFPN plus YFPC-VDAC3, no fluorescence signal was detected. Bars = 5 μm. (B) Colocalization of the KP1 and VDAC3 complex with mitochondria. In Arabidopsis mesophyll protoplasts transformed with the construct pairs KP1-tail-YFPN and YFPC-VDAC3, YFP fluorescence colocalized with mitochondria stained by MitoTracker. Bars = 5 μm. (C) Colocalization of VDAC3 with mitochondria. Arabidopsis mesophyll protoplasts transiently overexpressing GFP-VDAC3 were stained with MitoTracker. Bars = 5 μm. (D) LCI assay. The tobacco leaves were transformed by infiltration using a needleless syringe with the construct pairs KP1-NLuc/CLuc-VDAC3, KP1-tail-NLuc/CLuc-VDAC3, KP1-NLuc/CLuc, KP1-tail-NLuc/CLuc, NLuc/CLuc-VDAC3, VDAC3-Nluc/CLuc-KP1, VDAC3-Nluc/CLuc-KP1-tail, and NLuc/CLuc. Signal fluorescence was detected on the locations infiltrated by the construct pairs KP1-NLuc/CLuc-VDAC3 and KP1-tail-NLuc/CLuc-VDAC3. The left panel shows the bright-field image of the treated leaf.
Figure 5.
Figure 5.
Isolation of kp1 and vdac3 T-DNA Insertion Lines. (A) Diagram of the KP1 gene structure. Introns are shown as lines, and exons are shown as black boxes. Triangles indicate the locations of the T-DNA insertion sites for kp1-1 and kp1-2. (B) The gene structure of VDAC3 and the T-DNA insertion sites of the vdac3 mutants. Introns are shown as lines, and exons are shown as black boxes. Triangles indicate the locations of the T-DNA insertion sites. (C) RT-PCR analysis of the wild type (Col) and kp1 mutants. KP1 transcripts are absent in kp1 mutants. The UBQ5 transcript was amplified as an internal control. (D) RT-PCR analysis of the wild type (Col) and vdac3 mutants. VDAC3 transcripts are downregulated in vdac3 mutants. The UBQ5 gene was amplified as an internal control. Similar results were obtained with at least three biological replicates of the experiments.
Figure 6.
Figure 6.
The KP1-Tail Localized to Mitochondria in a VDAC3-Dependent Manner. GFP-VDAC3 merged with MitoTracker in Arabidopsis mesophyll protoplasts from kp1-1, but the KP1-tail-GFP fusion expressed in vdac3-1 protoplasts showed little colocalization with mitochondria.
Figure 7.
Figure 7.
KP1 Expression Increased during Seed Germination. Real-time PCR analyses of KP1 expression in the wild type during seed imbibition and germination at 22 (A) or 4°C (B). KP1 transcripts exhibit a sudden increase during this period. The 18S rRNA gene was amplified as an internal reference. Data represent the mean ± se of three independent biological determinations.
Figure 8.
Figure 8.
KP1 and VDAC3 Are Involved in Seed Germination at 4°C. (A) One-month-ripened seeds were germinated at 4°C with a light period of 16 h. The KP1 dominant-negative mutants, TAILOE, and vdac3 T-DNA insertion lines exhibited a higher seed germination frequency than the wild type (Col) at 4°C. Data points represent the mean ± se of three independent biological determinations. (B) The visually distinguishable phenotypes of the wild type (Col), mutants, and transgenic plants at day 15 after imbibition at 4°C. Bars = 2 mm. (C) The root length of different mutant lines at day 15 after imbibition at 4°C. Each value is the mean ± se of five independent biological determinations. Asterisks indicate a significant difference between mutants and Col: *P < 0.05; **P < 0.01.
Figure 9.
Figure 9.
The kp1 and vdac3 Mutants Have a Higher Aerobic Respiration Rate during Seed Germination at 4°C. Oxygen consumption was measured in kp1 and vdac3 mutants during the period of seed germination at 4°C by a Clark-type electrode. Each value is the mean ± se of three independent biological determinations. Asterisks indicate a significant difference between mutants and Col: *P < 0.05; **P < 0.01. DW, dry weight.
Figure 10.
Figure 10.
The Balance between the SHAM- and CN-Resistant Respiration Pathways in kp1 and vdac3 Mutants Is Disrupted. (A) The oxygen consumption of the SHAM- and CN-resistant respiration pathways (n = 3) in Col, kp1-1, kp1-2, vdac3-1, and VOE was measured. The test materials grown at 4°C for 10 d were treated with specific inhibitors: SHAM (15 mM) for cytochrome respiration and NaN3 (1 mM) for AOX respiration. The balance between SHAM- and CN-resistant respiration was disturbed in kp1 and vdac3 mutants, and the VDAC3 overexpression line (VOE) was able to restore the ratio of SHAM- to CN-resistant respiration in vdac3-1. Each value is the mean ± se of three independent biological determinations. Asterisks indicate a significant difference between mutants and Col: *P < 0.05; **P < 0.01. DW, dry weight. (B) The graph represents the transgenic constructs overexpressing VDAC3. A flag tag was fused to the N terminus of VDAC3. (C) Immunoblot identification of flag-VDAC3 in Col and VOE using an anti-flag antibody (1:10,000). Molecular markers are indicated in kilodaltons in the right margin.
Figure 11.
Figure 11.
ATP Measurements in kp1 and vdac3 Mutants Grown at 4°C. (A) Ten-day-old seedlings were used for ATP quantification by the luciferin-luciferase method. The ATP levels are lower in kp1-1, kp1-2, and vdac3-1 and are restored in VOE. Each value is the mean ± se of three independent biological determinations. Asterisks indicate significant differences between mutants and Col: *P < 0.05; **P < 0.01. FW, fresh weight. (B) Citrate synthase activities of 10-d-old Col, kp1-1, kp1-2, vdac3-1, and VOE grown at 4°C were assayed to eliminate the possibility of different mitochondrial numbers in the different lines examined. No significant differences were observed. Each value is the mean ± se of three independent biological determinations.
Figure 12.
Figure 12.
The Ratio of SHAM- to CN-Resistant Respiration and ATP Levels in TAILOE Dominant-Negative Mutants. (A) The oxygen consumption of the SHAM/CN-resistant respiration pathways (n = 3) in Col, TAILOE1, and TAILOE2 was measured. The balance between SHAM/CN-resistant respiration is disturbed in TAILOE lines. DW, dry weight. (B) The ATP levels are lower in TAILOE lines. Each value is the mean ± se of three independent biological determinations. Asterisks indicate significant differences between mutants and Col: *P < 0.05; **P < 0.01. FW, fresh weight.

References

    1. Abu-Hamad S., Sivan S., Shoshan-Barmatz V. (2006). The expression level of the voltage-dependent anion channel controls life and death of the cell. Proc. Natl. Acad. Sci. USA 103: 5787–5792 - PMC - PubMed
    1. Benz R. (1994). Permeation of hydrophilic solutes through mitochondrial outer membranes: Review on mitochondrial porins. Biochim. Biophys. Acta 1197: 167–196 - PubMed
    1. Bewley J.D. (1997). Seed germination and dormancy. Plant Cell 9: 1055–1066 - PMC - PubMed
    1. Bond D.R., Mester T., Nesbø C.L., Izquierdo-Lopez A.V., Collart F.L., Lovley D.R. (2005). Characterization of citrate synthase from Geobacter sulfurreducens and evidence for a family of citrate synthases similar to those of eukaryotes throughout the Geobacteraceae. Appl. Environ. Microbiol. 71: 3858–3865 - PMC - PubMed
    1. Cai Q., Gerwin C., Sheng Z.H. (2005). Syntabulin-mediated anterograde transport of mitochondria along neuronal processes. J. Cell Biol. 170: 959–969 - PMC - PubMed

MeSH terms