. 2011 Jun;4(3):223-31.
doi: 10.1161/CIRCGENETICS.110.958934. Epub 2011 Mar 15.

High-resolution identity by descent mapping uncovers the genetic basis for blood pressure differences between spontaneously hypertensive rat lines

Affiliations

High-resolution identity by descent mapping uncovers the genetic basis for blood pressure differences between spontaneously hypertensive rat lines

Rebecca Bell et al. Circ Cardiovasc Genet. 2011 Jun.

Abstract

Background: The recent development of a large panel of genome-wide single nucleotide polymorphisms (SNPs) provides the opportunity to examine genetic relationships between distinct SHR lines that share hypertension but differ in their susceptibility to hypertensive end-organ disease.

Methods and results: We compared genotypes at nearly 10,000 SNPs obtained for the hypertension end-organ injury-susceptible spontaneously hypertensive rat (SHR)-A3 (SHRSP, SHR-stroke prone) line and the injury-resistant SHR-B2 line. This revealed that that the 2 lines were genetically identical by descent (IBD) across 86.6% of the genome. Areas of the genome that were not IBD were distributed across 19 of the 20 autosomes and the X chromosome. A block structure of non-IBD comprising a total of 121 haplotype blocks was formed by clustering of SNPs inherited from different ancestors. To test the null hypothesis that distinct SHR lines share a common set of hypertension susceptibility alleles, we compared blood pressure in adult SHR animals from both lines and their F1 and F2 progeny using telemetry. In 16- to 18-week-old animals fed a normal diet, systolic blood pressure (SBP, mm Hg) in SHR-A3 was 205.7 ± 3.86 (mean ± SEM, n = 26), whereas in similar SHR-B2 animals, SBP was 186.7 ± 2.53 (n = 20). In F1 and F2 animals, SBP was 188.2 ± 4.23 (n = 19) and 185.6 ± 1.1 (n = 211), respectively (P<10(-6), ANOVA). To identify non-IBD haplotype blocks contributing to blood pressure differences between these SHR lines, we developed a high-throughput SNP genotyping system to genotype SNPs marking non-IBD blocks. We mapped a single non-IBD block on chromosome 17 extending over <10 Mb, at which SHR-A3 alleles significantly elevate blood pressure compared with SHR-B2.

Conclusions: Thus hypertension in SHR-A3 and -B2 appears to arise from an overlapping set of susceptibility alleles, with SHR-A3 possessing an additional hypertension locus that contributes to further increase blood pressure.


Conflict of interest statement

Conflict of Interest Disclosures: None

Figures

Figure 1
Figure 1
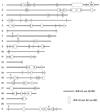
Using genotypes obtained from DNA provided to the STAR Consortium we constructed a 10K SNP map to identify genomic regions in which SHR-A3 and SHR-B2 were identical by descent (IBD, solid black line) or from which the inbred lines were descended from different ancestors (open box). SNPs marking these blocks were subsequently genotyped by mass spectrometry in the two parental lines and in 211 F2 progeny of a cross between SHR-A3 and SHR-B2. We successfully genotyped SNPs tagging all non-IBD blocks except those blocks indicated with an asterisk above the block.
Figure 2
Figure 2
Distribution of systolic blood pressure in SHR-A3, SHR-B2, F1A3B2 and F2A3B2 rats. ANOVA followed by post hoc testing indicated that no differences exist between systolic blood pressure comparing SHR-B2 with F1A3B2, SHR-B2 with F2A3B2 and F1A3B2 with F2A3B2. Highly significant differences in systolic blood pressure were detected between SHR-A3 and SHR-B2, SHR-A3 and F1A3B2 and between SHR-A3 and F2A3B2 (all <0.001 Fisher’s LSD test). See Table 2 for average systolic, mean and diastolic blood pressure values in these lines and crosses.
Figure 3
Figure 3
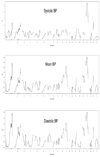
a.) Genome-wide LOD scores for systolic, mean and diastolic blood pressure measured by telemetry in 211 male F2 progeny of a cross between SHR-A3 and SHR-B2. b) Chromosome 17 interval mapping. The only regions at which SHR-A3 and SHR-B2 are not identical by descent on this chromosome are at the proximal and distal ends of the chromosome (indicated by gray bocks above the x-axis). We interpret the peak most likely to be associated with the proximal block from 10.4 to 19.6 Mb because the two distal blocks of non-IBD extend over less than 3Mb and contain SNP markers that were both well below the significance threshold. Localization of the LOD peak to 18cM is inconsistent with the absence of sequence variation across this region and reflects limitations of mapping using maximum likelihood estimation when the majority of the chromosome is IBD. Marker positions are indicated by hatch marks on the x axis and correspond from left to right to the following SNP ID’s from dbSNP or Ensembl, rs63927241, rs8161430, ENSRNOSNP2739739, rs65051030, and rs63777286.
Figure 3
Figure 3
a.) Genome-wide LOD scores for systolic, mean and diastolic blood pressure measured by telemetry in 211 male F2 progeny of a cross between SHR-A3 and SHR-B2. b) Chromosome 17 interval mapping. The only regions at which SHR-A3 and SHR-B2 are not identical by descent on this chromosome are at the proximal and distal ends of the chromosome (indicated by gray bocks above the x-axis). We interpret the peak most likely to be associated with the proximal block from 10.4 to 19.6 Mb because the two distal blocks of non-IBD extend over less than 3Mb and contain SNP markers that were both well below the significance threshold. Localization of the LOD peak to 18cM is inconsistent with the absence of sequence variation across this region and reflects limitations of mapping using maximum likelihood estimation when the majority of the chromosome is IBD. Marker positions are indicated by hatch marks on the x axis and correspond from left to right to the following SNP ID’s from dbSNP or Ensembl, rs63927241, rs8161430, ENSRNOSNP2739739, rs65051030, and rs63777286.
Figure 4
Figure 4
Effect on systolic blood pressure in F2 animals of an SHR-A3 x SHR-B2 intercross of the inheritance of SHR-A3 (A) or SHR-B2 (B) alleles at the chromosome 17 BP locus (N = 211, p<0.002). The marker used for this analysis was rs63927241.

References

    1. Okamoto K, Yamori Y, Nosaka S, Ooshima A, Hazama F. Studies on hypertension in spontaneously hypertensive rats. Clin Sci Mol Med Suppl. 1973;(45 Suppl 1) 11s-14. - PubMed
    1. Okamoto K, Yamori Y, Nagaoka A. Establishment of the stroke-prone spontaneously hypertensive rat. Circ. Res. 1974;34/35:I-143–I-153.
    1. Nagaoka A, Iwatsuka H, Suzuoki Z, Okamoto K. Genetic predisposition to stroke in spontaneously hypertensive rats. Am J Physiol. 1976;230:1354–1359. - PubMed
    1. Gigante B, Rubattu S, Stanzione R, Lombardi A, Baldi A, Baldi F, Volpe M. Contribution of genetic factors to renal lesions in the stroke-prone spontaneously hypertensive rat. Hypertension. 2003;42:702–706. - PubMed
    1. Hilbert P, Lindpaintner K, Beckmann JS, Serikawa T, Soubrier F, Dubay C, Cartwright P, De Gouyon B, Julier C, Takahasi S, Vincent M, Ganten D, Georges M, Lathrop GM. Chromosomal mapping of two genetic loci associated with blood-pressure regulation in hereditary hypertensive rats. Nature. 1991;353:521–529. - PubMed

Publication types