. 2010 Dec 15;22(49):494110.
doi: 10.1088/0953-8984/22/49/494110.

Effect of magnesium ions and temperature on the sequence-dependent curvature of DNA restriction fragments

Effect of magnesium ions and temperature on the sequence-dependent curvature of DNA restriction fragments

Nancy C Stellwagen et al. J Phys Condens Matter. .

Abstract

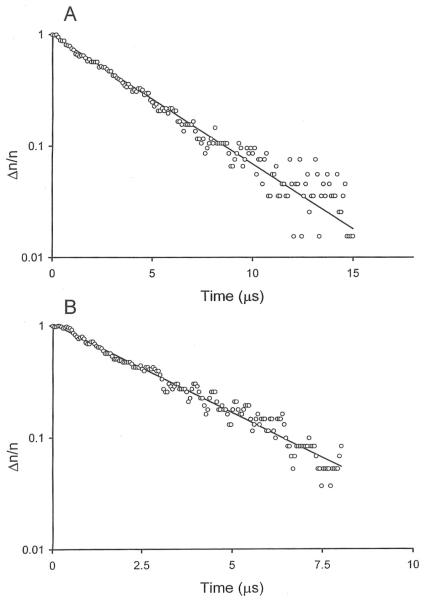
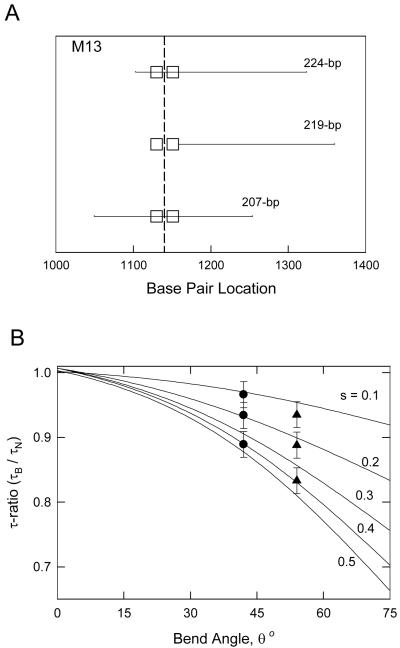
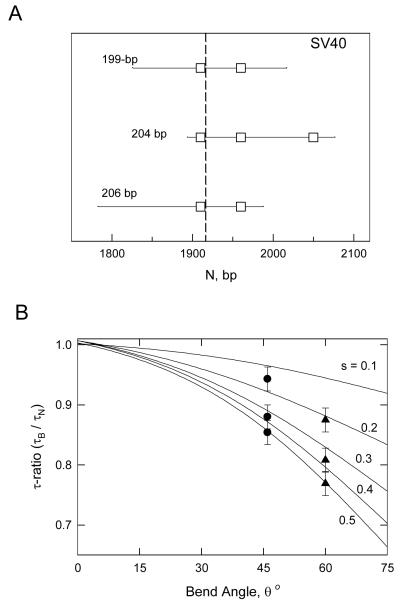
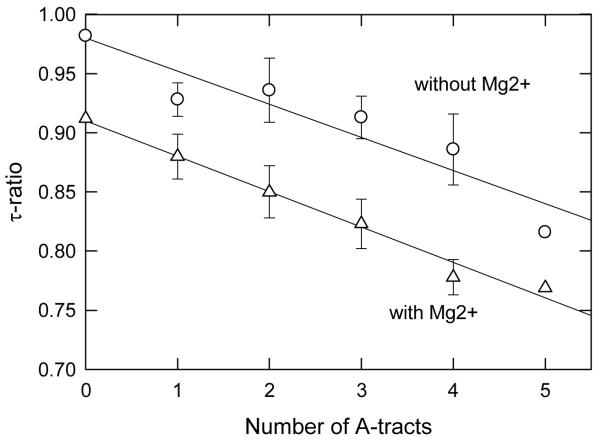
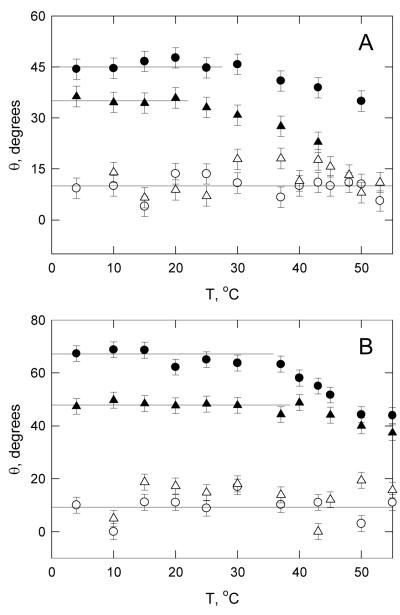
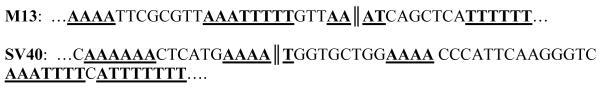
Transient electric birefringence has been used to quantify the curvature of two DNA restriction fragments, a 199-base-pair fragment taken from the origin of replication of the M13 bacteriophage and a 207-base-pair fragment taken from the VP1 gene in the SV40 minichromosome. Stable curvature in the SV40 and M13 restriction fragments is due to a series of closely spaced A tracts, runs of 4-6 contiguous adenine residues located within 40 or 60 base pair 'curvature modules' near the center of each fragment. The M13 and SV40 restriction fragments exhibit bends of ∼ 45° in solutions containing monovalent cations and ∼ 60° in solutions containing Mg(2 +) ions. The curvature is not localized at a single site but is distributed over the various A tracts in the curvature modules. Thermal denaturation studies indicate that the curvature in the M13 and SV40 restriction fragments remains constant up to 30 °C in solutions containing monovalent cations, and up to 40 °C in solutions containing Mg(2 +) ions, before beginning to decrease slowly with increasing temperature. Hence, stable curvature in these DNA restriction fragments exists at the biologically important temperature of 37 °C.


Figures

Figure 1
Figure 1
Semilogarithmic plots of the dependence of the fractional decay of the birefringence, Δn/n, of the 199-bp SV40 fragment on the time elapsed after removal of the electric field, in μs. A, Decay observed in buffer B, without Mg2+ ions, τ = 3.74 μs; B, decay observed in buffer F, containing 0.1 mM Mg2+ ions, τ = 2.83 μs.
Figure 2
Figure 2
Overlapping M13 restriction fragments. A, Schematic diagram of the sequences of the overlapping 224-, 219- and 207-bp fragments. The square boxes represent A-tracts in each fragment containing 6 or more contiguous A or T residues. The apparent bend center is indicated by a vertical dashed line. B, Theoretical curves (solid lines) relating τ-ratios to bend angles and the relative distance, s, of the bend from the end of the fragment. (●), Average τ-ratios of the 224-, 219- and 207-bp M13 fragments (from top to bottom) in buffers B and C (without Mg2+ ions); (▲), τ-ratios of the same fragments in buffer F, with Mg2+ ions.
Figure 3
Figure 3
Overlapping SV40 restriction fragments. A, Schematic diagram of the sequences of the 199-, 204- and 206-bp fragments. The square boxes represent A-tracts in each fragment containing 6 or more A or T residues. The apparent bend center is indicated by a vertical dashed line. B, Theoretical curves (solid lines) relating τ-ratios to bend angles and the relative distance, s, of the bend from the end of the fragment. (●), Average τ-ratios of the 204-, 206- and 199-bp fragments (from top to bottom) in buffers B and C, without Mg2+ ions; (▲), τ-ratios of the same fragments in buffer F, with Mg2+ ions.
Figure 4
Figure 4
Dependence of the τ-ratios observed for SV40 sequence variants containing different numbers of A-tracts in the curvature module on the number of A-tracts. The error bars represent the average τ-ratios observed for sequence variants containing the same number of A-tracts. (○), τ-ratios observed in buffers B and C, without Mg2+ ions; and (△), τ-ratios observed in buffer F, with Mg2+ ions. The lines were drawn by linear regression (r2 = 0.88 for buffers B and C; r2 = 0.98 for buffer F).
Figure 5
Figure 5
Dependence of the apparent bend angles observed for curved and normal DNAs on temperature. A, buffer B, without Mg2+ ions; and B, buffer F, with Mg2+ ions. The DNAs are: (○), normal 198-bp fragment; (△), normal 209-bp fragment; (●), curved 199-bp SV40 fragment; (▲), curved 207-bp M13 fragment. The horizontal lines are drawn to guide the eye.
Scheme 1
Scheme 1
Top: Litmus 28 sequence from 1128 to 1167 bp, containing the M13 origin of replication. Bottom: SV40 sequence from 1904 to 1964 bp. A- and T-tracts in each sequence containing four or more A or T residues without an intervening TA step are indicated by bold type and underlining. The locations of the apparent bend centers are indicated by double vertical lines.

Similar articles

Cited by

References

    1. Hagerman P. Annu. Rev. Biophys. Biophys. Chem. 1988;17:265–286. - PubMed
    1. Lu YJ, Weers B, Stellwagen NC. Biopolymers. 2002;61:261–275. - PubMed
    1. Olson WK, Zhurkin VB. Biological Structure and Dynamics. Adenine Press; Schenectady, NY: 1996. pp. 341–370.
    1. Hud NV, Plavec J. Biopolymers. 2003;69:144–159. - PubMed
    1. Haran TE, Mohanty U. Q. Rev. Biophys. 2009;42:41–81. - PubMed

LinkOut - more resources