. 2011 Jul;19(7):807-12.
doi: 10.1038/ejhg.2011.39. Epub 2011 Mar 16.

Genomic inflation factors under polygenic inheritance

Affiliations

Genomic inflation factors under polygenic inheritance

Jian Yang et al. Eur J Hum Genet. 2011 Jul.

Abstract

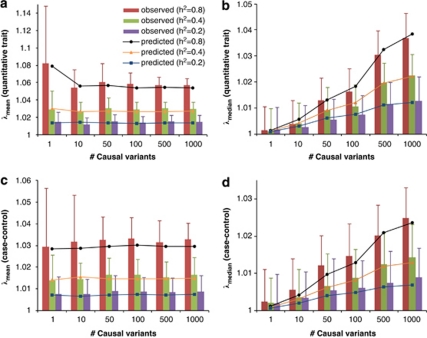
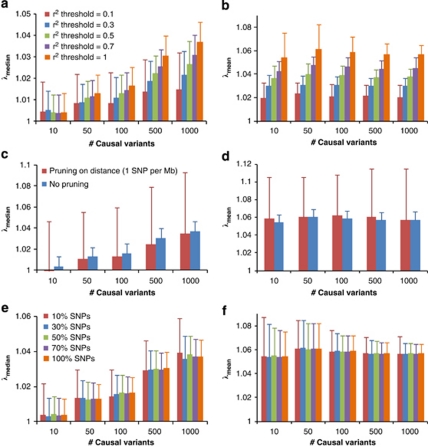
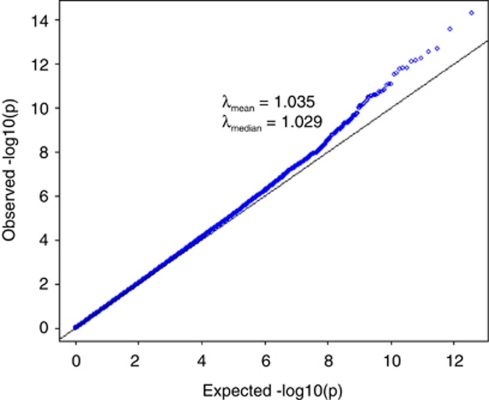
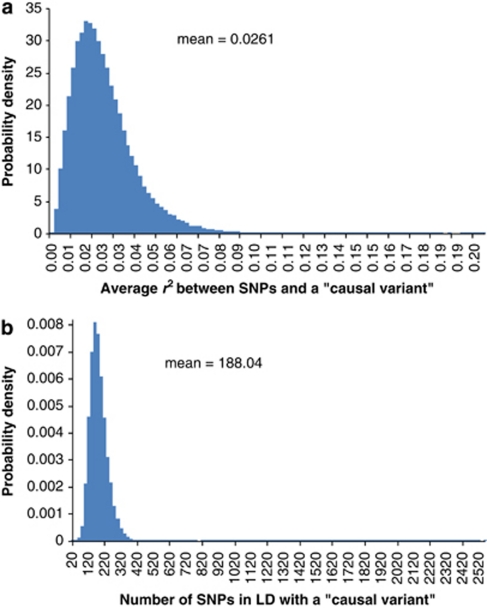
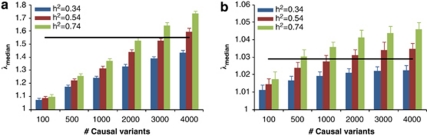
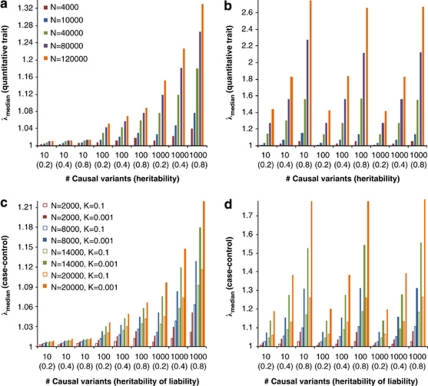
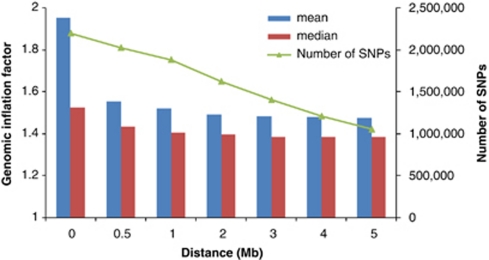
Population structure, including population stratification and cryptic relatedness, can cause spurious associations in genome-wide association studies (GWAS). Usually, the scaled median or mean test statistic for association calculated from multiple single-nucleotide-polymorphisms across the genome is used to assess such effects, and 'genomic control' can be applied subsequently to adjust test statistics at individual loci by a genomic inflation factor. Published GWAS have clearly shown that there are many loci underlying genetic variation for a wide range of complex diseases and traits, implying that a substantial proportion of the genome should show inflation of the test statistic. Here, we show by theory, simulation and analysis of data that in the absence of population structure and other technical artefacts, but in the presence of polygenic inheritance, substantial genomic inflation is expected. Its magnitude depends on sample size, heritability, linkage disequilibrium structure and the number of causal variants. Our predictions are consistent with empirical observations on height in independent samples of ~4000 and ~133,000 individuals.


Figures

Figure 1
Figure 1
Genomic inflation factor observed in simulation versus that predicted by theory. Data are simulated based on real genotypes of 3925 individuals and 294 831 SNPs with different numbers of causal variants (m=1, 10, 50, 100, 500 and 1000) and heritabilities (h2=0.2, 0.4 and 0.8). Each column represents the average of λmean (a and c) or λmedian (b and d) observed from 100 simulations. Error bars are SD. Each marked line represents the predicted λmean or λmedian averaged over 100 prediction replicates given m and h2. For case–control studies (c and d), h2 refers to heritability of liability on the underlying scale.
Figure 2
Figure 2
Genomic inflation factor for pruned (or selected) SNPs in simulation study. GWAS for quantitative trait is simulated based on real genotypes of 3925 individuals and 294 831 SNPs with heritability of 0.8 and with different numbers of causal variants (10, 50, 100, 500 and 1000). Each column represents an average of λmean (b, d and f) or λmedian (a, c and e) observed from 100 simulations. Error bars are SD. In (a and b), SNPs are pruned for LD using PLINK22 with threshold r2 value of 0.1, 0.3, 0.5 and 0.7. In (c and d), SNPs are pruned based on physical distance so that any pair of SNPs are at least 1 Mb away from each other. In (e and f), 10, 30, 50 and 70% SNPs are randomly sampled from all of the SNPs.
Figure 3
Figure 3
Quantile–quantile plot of height association result for QIMR data set (3925 unrelated individuals and 294 831 SNPs). All the SNPs passed stringent quality control and all the individuals are of European ancestry as verified by SNP data. The mean and median of χ2-statistics are 1.035 and 1.029, respectively.
Figure 4
Figure 4
Histograms of (a) number of SNPs in significant LD with a ‘causal variant' and (b) average r2 between these SNPs and the ‘causal variant'. The ‘causal variants' are mimicked by randomly sampling (without replacement) 100 000 out of 294 831 SNPs across the genome. Simple regression is used to test for SNPs in LD with each ‘causal variant' within 5-Mb distance in either direction.
Figure 5
Figure 5
Predicted median of χ2-statistics (λmedian) of height association study in (a) the QIMR data and (b) the GIANT meta-analysis. Each column is mean±2SD of 25 prediction replicates. The straight lines are the observed λmedian in real data analyses.
Figure 6
Figure 6
Predicted genomic inflation factor for quantitative trait (a and b) and case–control (c and d) association studies. Prediction is based on 294 831 SNPs with different numbers of causal variants and heritabilities (h2), sample size (N) and disease prevalences (K, for case–control study). Each value is an average over 100 prediction replicates. For the case–control study, the number of cases and controls is equal.
Figure 7
Figure 7
Genomic inflation factor for ∼2.2-M SNPs (with exclusion of ∼636K with effective sample sizes <126 000 from the total ∼2.8 M SNPs) in GIANT meta-analysis for height with ∼133 000 samples. A total of 318 top hits were identified by GIANT meta-analysis (genome-wide false discovery rate of 0.05). Any SNP within d Mb distance (d=0.5, 1, …, or 5, x-axis) of the top hits is removed and genomic inflation factor is calculated using all of the remaining SNPs.

References

    1. Hindorff LA, Sethupathy P, Junkins HA, et al. Potential etiologic and functional implications of genome-wide association loci for human diseases and traits. Proc Natl Acad Sci USA. 2009;106:9362–9367. - PMC - PubMed
    1. Maher B. Personal genomes: the case of the missing heritability. Nature. 2008;456:18–21. - PubMed
    1. Manolio TA, Collins FS, Cox NJ, et al. Finding the missing heritability of complex diseases. Nature. 2009;461:747–753. - PMC - PubMed
    1. Speliotes EK, Willer CJ, Berndt SI, et al. Association analyses of 249 796 individuals reveal 18 new loci associated with body mass index. Nat Genet. 2010;42:937–948. - PMC - PubMed
    1. Lango Allen H, Estrada K, Lettre G, et al. Hundreds of variants clustered in genomic loci and biological pathways affect human height. Nature. 2010;467:832–838. - PMC - PubMed

Publication types