. 2011 Mar 9;6(3):e17589.
doi: 10.1371/journal.pone.0017589.

Contribution of CgPDR1-regulated genes in enhanced virulence of azole-resistant Candida glabrata

Affiliations

Contribution of CgPDR1-regulated genes in enhanced virulence of azole-resistant Candida glabrata

Sélène Ferrari et al. PLoS One. .

Abstract

In Candida glabrata, the transcription factor CgPdr1 is involved in resistance to azole antifungals via upregulation of ATP binding cassette (ABC)-transporter genes including at least CgCDR1, CgCDR2 and CgSNQ2. A high diversity of GOF (gain-of-function) mutations in CgPDR1 exists for the upregulation of ABC-transporters. These mutations enhance C. glabrata virulence in animal models, thus indicating that CgPDR1 might regulate the expression of yet unidentified virulence factors. We hypothesized that CgPdr1-dependent virulence factor(s) should be commonly regulated by all GOF mutations in CgPDR1. As deduced from transcript profiling with microarrays, a high number of genes (up to 385) were differentially regulated by a selected number (7) of GOF mutations expressed in the same genetic background. Surprisingly, the transcriptional profiles resulting from expression of GOF mutations showed minimal overlap in co-regulated genes. Only two genes, CgCDR1 and PUP1 (for PDR1 upregulated and encoding a mitochondrial protein), were commonly upregulated by all tested GOFs. While both genes mediated azole resistance, although to different extents, their deletions in an azole-resistant isolate led to a reduction of virulence and decreased tissue burden as compared to clinical parents. As expected from their role in C. glabrata virulence, the two genes were expressed as well in vitro and in vivo. The individual overexpression of these two genes in a CgPDR1-independent manner could partially restore phenotypes obtained in clinical isolates. These data therefore demonstrate that at least these two CgPDR1-dependent and -upregulated genes contribute to the enhanced virulence of C. glabrata that acquired azole resistance.


Conflict of interest statement

Competing Interests: The authors have declared that no competing interests exist.

Figures

Figure 1
Figure 1. Expression profiles of C. glabrata genes regulated by GOFs in CgPDR1.
Panel A: Pairwise comparisons of gene expression changes relative to SFY114 carrying the wild type CgPDR1 allele. Each data point correlate the same gene expressed in strain SFY116 (P822L GOF) versus strain SFY103 (P1082G GOF) (left side) and in strain SFY116 (P822L GOF) versus strain SFY101 (R376W GOF). For each diagram, r2 values are given. Panel B: K-means clustering of the normalized expression levels of the 626 genes regulated (≥2-fold) by at least one CgPDR1 GOF. Clustering was performed with Genespring® GX (parameters: Euclidian distance metric, 100 iterations, 4 clusters). For each cluster, enriched biological function and biological component were determined using GO terms of S. cerevisiae homologues. Results are given below the cluster analysis.
Figure 2
Figure 2. Localization of Pup1p in mitochondria.
SFY174 cells expressing the Pup1p-GFP fusion protein were stained with Mitotracker Red and fixed as described in Materials and Methods. Panel A: Nomarski images of the cells; panel B: Pup1p-GFP; panel C: mitochondria stained with Mitotracker Red; panel D: merging of B and C. Four individual images are shown. Bar, 5 µm.
Figure 3
Figure 3. Expression of CgCDR1 and PUP1 in vitro.
Panel A: Expression of CgCDR1 and PUP1 in isolates containing distinct CgPDR1 alleles. Panel B: Expression of PUP1 after exposure to 256 µg ml−1 fluconazole during 150 min. Quantification was performed by qRT-PCR. The values are averages of three separate experiments and represent the increase in gene expression relative to DSY562 (set at 1.00). Strains were constructed from a pdr1Δ mutant and were named by the re-introduced GOF mutation or wild type CgPDR1 allele. The indicated names correspond to the following strains: pdr1Δ: SFY92, PDR1: SFY114, L280F: SFY115, R376W: SFY101, Y584C: SFY111, T588A: SFY105, P822L: SFY116, D1082G: SFY103, E1083Q: SFY109).
Figure 4
Figure 4. Expression of CgCDR1 and PUP1 in vivo.
Flow cytometry analysis of GFP-positive yeast cells was performed from mice kidneys. Groups of 4 mice were injected intravenously with 4×10⁷ CFU of C. glabrata strains. Mice were sacrificed at day 7 post-infection. Results are expressed as percents of GFP-positive events in FACS and represent values recorded separately for each mouse. Asterisks indicate statistically significant differences (*: P<0.05; **: P<0.01, ***: P<0.001). Strains SFY167 and SFY168 express the CgCDR1p-3xGFP construct and are derived from DSY562 and DSY565, respectively. Strains SFY173 and SFY174 express the PUP1-3xGFP construct and are derived from DSY562 and DSY565, respectively. As controls, kidneys of uninfected mice (mock) were analyzed alone or mixed with 1×10⁷ cells of SFY168 or SFY174 grown in YEPD.
Figure 5
Figure 5. Virulence of C. glabrata is dependent on CgCDR1 and PUP1.
Survival curves of mice infected with DSY562 (panel A) and DSY565 (panel B) and derived mutants. Statistical differences were performed using the Log-rank Mantel-Cox test (Prism 5.0) by comparing survival curves of mice infected by the parental strains (DSY562 or DSY565) and by other strains as indicated. Asterisks indicate statistically significant differences (*: P<0.05; **: P<0.01, ***: P<0.001). NS indicates no significance (P>0.05). For strains derived from DSY562, the indicated names correspond to the following strains: pdr1Δ: SFY92, cdr1Δ: SFY148, CDR1rev: SFY161, pup1Δ: SFY150, PUP1rev: SFY159, cdr1Δ, pup1Δ: SFY152. For strains derived from DSY565, the indicated names correspond to the following strains: pdr1Δ: SFY94, cdr1Δ: SFY149, CDR1rev: SFY162, pup1Δ: SFY151, PUP1rev: SFY160, cdr1Δ, pup1Δ: SFY153.
Figure 6
Figure 6. C. glabrata tissue burdens in murine infection models.
Fungal tissue burdens in kidneys (panel A) and spleen (panel B) from BALB/c mice infected intravenously with 4×10⁷ viable cells of C. glabrata strains. Mice were sacrificed at day 7 post-infection. Results are expressed as CFUs per gram of tissue and represent values recorded separately for each of the ten mice. Geometric means are indicated by horizontal bars. Statistical comparisons are summarized above each panel. Asterisks indicate statistically significant differences (*: P<0.05; **: P<0.01, ***: P<0.001). NS indicates no significance (P>0.05). The symbol ‘-’ indicates that the statistical comparison was not performed. Statistical differences were determined using the non-parametric Wilcoxon Rank sum tests (Prism 5.0). The origin of each strain is indicated; strain background (DSY562 and DSY565) is indicated by filled or empty symbols, respectively. See legend of Fig. 5 for strain designations.
Figure 7
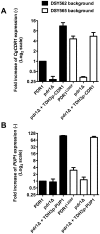
Figure 7. Overexpression of CgCDR1 and PUP1 in a CgPDR1-independent manner.
Panel A: TDH3-dependent expression of CgCDR1. Panel B: TDH3-dependent expression of PUP1. Quantification was performed by qRT-PCR. The values are averages of three separate experiments and represent the increase in gene expression relative to SFY196 (set at 1.00). Strains derived from DSY562 are represented by black bars and the indicated names correspond to the following strains: PDR1: SFY196, pdr1Δ: SFY198, pdr1Δ+TDH3p-CDR1: SFY200, pdr1Δ+TDH3p-PUP1: SFY202. Strains derived from DSY565 are represented by white bars and the indicated names correspond to the following strains: PDR1L280F: SFY197, pdr1Δ: SFY199, pdr1Δ+TDH3p-CDR1: SFY201, pdr1Δ+TDH3p-PUP1: SFY203.
Figure 8
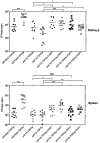
Figure 8. Effect of CgCDR1 and PUP1 overexpression on tissue colonization.
Panel A: Fungal tissue burdens in kidneys. Panel B: Fungal tissue burdens in spleen. Tissue burden were determined from BALB/c mice infected intravenously with 4×10⁷ viable cells of C. glabrata strains. Mice were sacrificed at day 7 post-infection. Results are expressed as CFUs per gram of tissue and represent values recorded separately for each of the ten mice. Geometric means are indicated by horizontal bars and asterisks indicate statistically significant differences (*: P<0.05; **: P<0.01, ***: P<0.001). NS indicates no significance (P>0.05). Statistical differences were determined using the non-parametric Wilcoxon Rank sum tests (Prism 5.0). Strain background (DSY562 and DSY565) is indicated by filled or empty symbols, respectively. For strains derived from DSY562, the indicated names correspond to the following strains: DSY562-TDH3p: SFY196; pdr1Δ-TDH3p: SFY198; pdr1Δ-TDH3p-CDR1: SFY200 pdr1Δ-TDH3p-PUP1: SFY202. For strains derived from DSY565, the indicated names correspond to the following strains: DSY562-TDH3p: SFY197; pdr1Δ-TDH3p: SFY199; pdr1Δ-TDH3p-CDR1: SFY201 pdr1Δ-TDH3p-PUP1: SFY203.
Figure 9
Figure 9. Virulence of C. glabrata in strains overexpressing CgCDR1 and PUP1.
Immuno-suppressed mice were infected as described in Material and Methods with strain derived from DSY562 and DSY565. Statistical differences were performed using the Log-rank Mantel-Cox test (Prism 5.0) by comparing survival curves of mice infected by the strains as indicated. The comparison between DSY565-TDH3p and DSY565-TDH3p was significant (p = 0.04) while comparisons of strains overexpression CgCDR1 and PUP1 with parents (pdr1Δ-TDH3) was not significant. See legend of Fig. 8 for strain designations.

References

    1. Kaur R, Domergue R, Zupancic ML, Cormack BP. A yeast by any other name: Candida glabrata and its interaction with the host. Curr Opin Microbiol. 2005;8:378–384. - PubMed
    1. Ruhnke M. Epidemiology of Candida albicans infections and role of non-Candida albicans yeasts. Curr Drug Targets. 2006;7:495–504. - PubMed
    1. Pfaller MA, Diekema DJ. Epidemiology of invasive candidiasis: a persistent public health problem. Clin Microbiol Rev. 2007;20:133–163. - PMC - PubMed
    1. Pfaller MA, Diekema DJ, Gibbs DL, Newell VA, Barton R, et al. Geographic variation in the frequency of isolation and fluconazole and voriconazole susceptibilities of Candida glabrata: an assessment from the ARTEMIS DISK Global Antifungal Surveillance Program. Diagn Microbiol Infect Dis. 2010;67:162–171. - PubMed
    1. Sanglard D, Odds FC. Resistance of Candida species to antifungal agents: molecular mechanisms and clinical consequences. Lancet Infect Dis. 2002;2:73–85. - PubMed

Publication types

MeSH terms