. 2011 Mar 8;5(3):e1009.
doi: 10.1371/journal.pntd.0001009.

An atlas for Schistosoma mansoni organs and life-cycle stages using cell type-specific markers and confocal microscopy

Affiliations

An atlas for Schistosoma mansoni organs and life-cycle stages using cell type-specific markers and confocal microscopy

James J Collins 3rd et al. PLoS Negl Trop Dis. .

Abstract

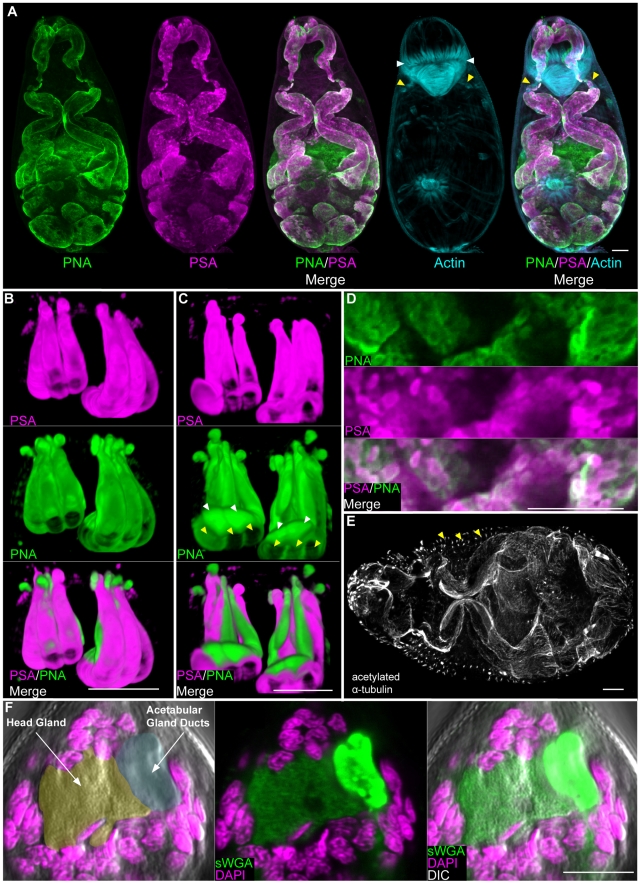
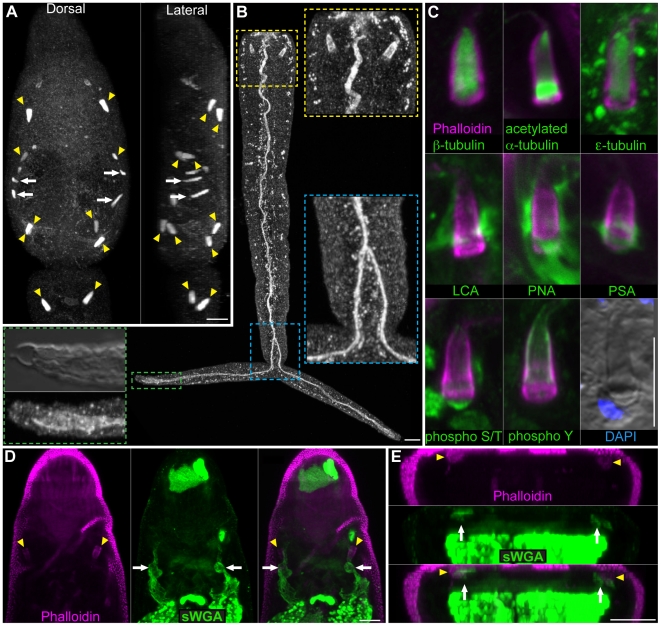
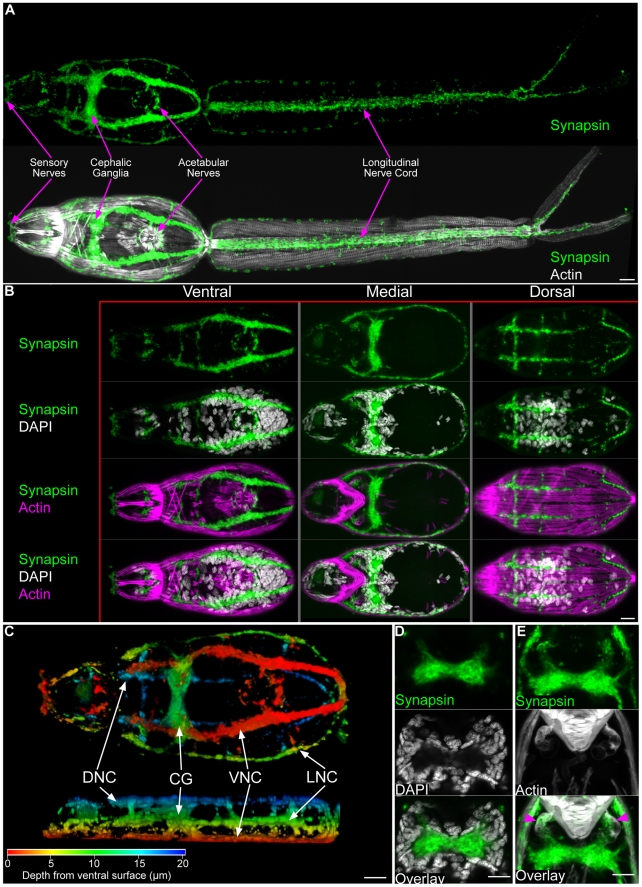
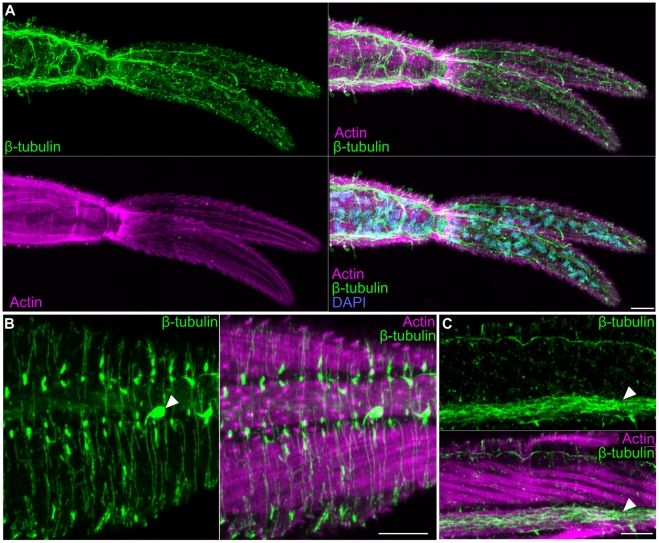
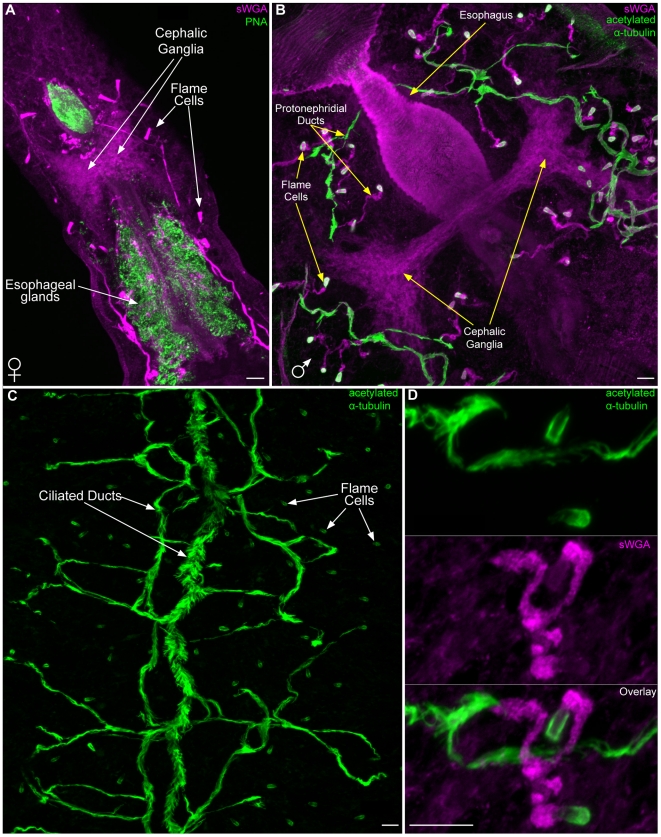
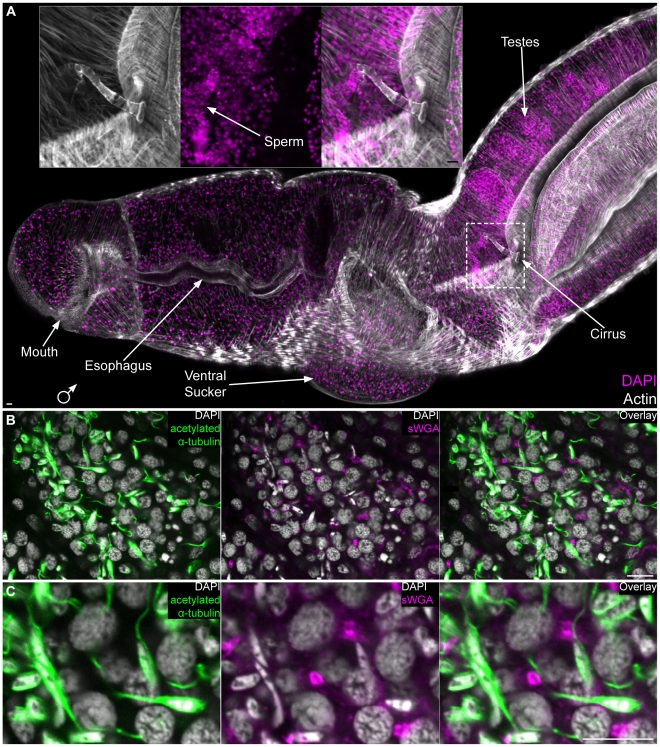
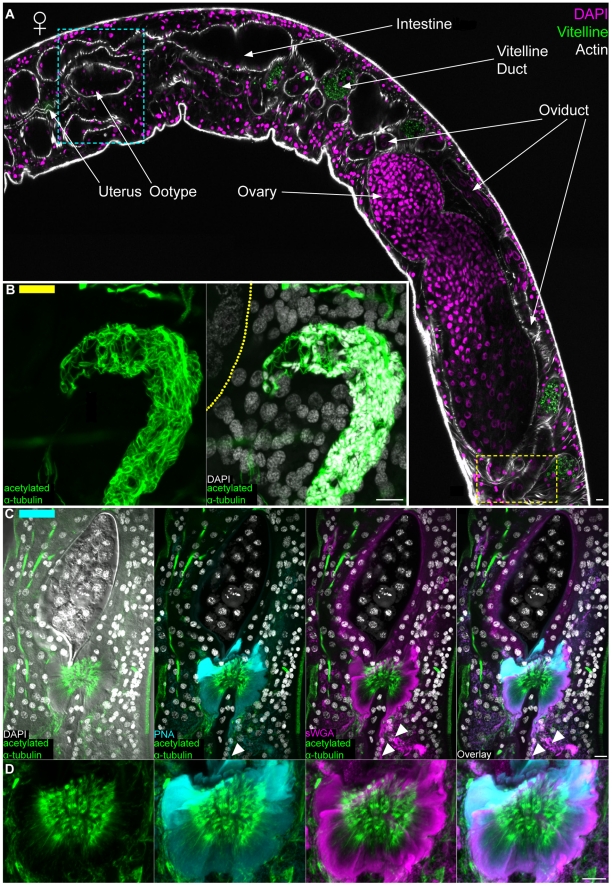
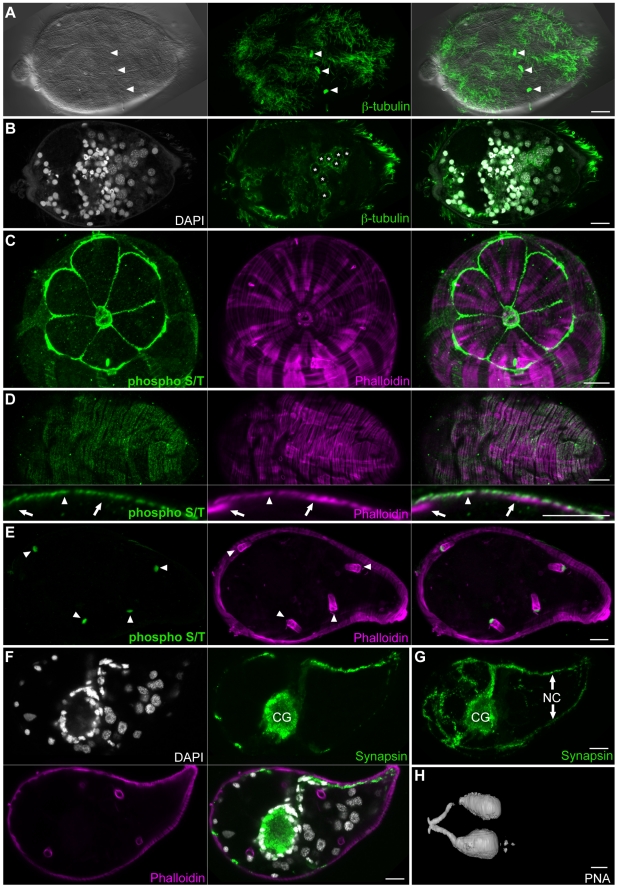
Schistosomiasis (bilharzia) is a tropical disease caused by trematode parasites (Schistosoma) that affects hundreds of millions of people in the developing world. Currently only a single drug (praziquantel) is available to treat this disease, highlighting the importance of developing new techniques to study Schistosoma. While molecular advances, including RNA interference and the availability of complete genome sequences for two Schistosoma species, will help to revolutionize studies of these animals, an array of tools for visualizing the consequences of experimental perturbations on tissue integrity and development needs to be made widely available. To this end, we screened a battery of commercially available stains, antibodies and fluorescently labeled lectins, many of which have not been described previously for analyzing schistosomes, for their ability to label various cell and tissue types in the cercarial stage of S. mansoni. This analysis uncovered more than 20 new markers that label most cercarial tissues, including the tegument, the musculature, the protonephridia, the secretory system and the nervous system. Using these markers we present a high-resolution visual depiction of cercarial anatomy. Examining the effectiveness of a subset of these markers in S. mansoni adults and miracidia, we demonstrate the value of these tools for labeling tissues in a variety of life-cycle stages. The methodologies described here will facilitate functional analyses aimed at understanding fundamental biological processes in these parasites.


Conflict of interest statement

The authors have declared that no competing interests exist.

Figures

Figure 1
Figure 1. Superficial structures and musculature of cercariae.
(A and B) Actin-rich spines and sensory cilia. (A) Anterior region of the head as seen by Differential Interference Contrast (DIC) optics, phalloidin staining to visualize actin, and immunofluorescence with an anti-β-tubulin antibody to label cilia. Images are maximum confocal projections. Bottom, overlay showing distribution of actin and β-tubulin. Arrow indicates an actin-rich channel though which a sensory cilium projects. (B) Maximum confocal projection of a cross section though the tail showing a sensory cilium (green) crossing the musculature (magenta) to project to the outside (right). (C and D) Single confocal sections depicting staining with lectin PSA that labels the basement membrane below the tegument. Panels C and D represent distinct confocal sections of the same animal. (E) Single confocal section through the head showing staining with lectins PSA and PNA and with phalloidin to visualize actin. PSA labels the basement membrane between the actin-rich surface spines and the muscle layer (yellow arrow). PNA marks a layer of material at the level of the actin spines which may represent the tegument or the associated glycocalyx (red arrow). (F) Phalloidin staining in various anatomical regions. Magenta box, actin spines and anterior sensory structures. Green box, longitudinal (white arrowhead), circular (yellow arrowhead), and diagonal muscle fibers (magenta arrowhead). Yellow box, acetabulum and the interface between the head and the tail. Note the intense radially symmetric spheres of phalloidin staining (cyan arrowhead); because of the proximity of these structures to longitudinal muscles in the head and tail, we suggest this staining may represent sites of muscle attachment. White box, longitudinal and helical muscles (green arrowhead) of the tail. Whole cercaria image represents a maximum projection derived from tiled stacks. Insets are magnified views of the indicated regions. All images are maximum projections generated from a Z-stack though an entire animal, except for the green inset that was derived from a subset of optical sections. (G and H) Depth projections showing phalloidin staining of the acetabulum and associated musculature. Scale shown below indicates the color-coding of distances from the ventral surface (i.e. the colors transition from red (ventral) to blue (dorsal) moving deeper into the animal). Panel G represents a dorsal view whereas panel H depicts a transverse section with the ventral surface towards the top. (I) Immunofluorescence with an anti-phospho S/T antibody that labels the longitudinal muscles of the tail. Scale bars, 10 µm. Anterior faces up in panel A and to the left in panels C, D, and F.
Figure 2
Figure 2. The secretory glands of cercariae.
(A) Maximum confocal projections showing labeling of the entire pre- and post- acetabular gland system with lectins PNA and PSA. Yellow arrowheads indicate musculature surrounding the anterior ducts of the acetabular glands and white arrowheads indicate the muscle cone. (B and C) 3D-renderings showing magnified views of the acetabular gland ducts anterior to the muscle cone. The six post-acetabular gland ducts (yellow arrowheads) labeled with both PNA and PSA. PNA labeled the four pre-acetabular ducts (white arrowheads) whereas PSA did not. Panel B represents a ventral view; panel C represents a dorsal view. (D) Secretory globules within the post-acetabular glands labeled with PNA and PSA. (E) Immunofluorescence with an anti-acetylated α-tubulin antibody showing the microtubule-rich periphery of the pre- and post- acetabular glands. Arrowheads indicate putative sensory papillae. (F) sWGA labels the head gland. Left, DIC and DAPI staining. Head gland is pseudocolored orange and acetabular gland ducts are pseudocolored cyan. Center and right most panels show staining with sWGA. Scale bars, 10 µm. Anterior faces up in panels A, B, C and F and to the left in panel E.
Figure 3
Figure 3. The protonephridial system of cercariae.
(A) Immunofluorescence with an anti-β-tubulin antibody to label the ciliated tufts of the flame cells (yellow arrowheads) and ciliated regions of the protonephridial tubules (white arrows) within the head and tail. Cercariae typically have 10 flame cells, an anterior dorsal pair, a mid-head ventral pair, posterior head dorsal and ventral pairs, and a pair at the anterior tail. Dorsal view is shown to the left and a lateral view is shown to the right. (B) Immunofluorescence with an anti-phospho Y antibody that labels the barrel of the flame cells and the excretory duct. Inserts are magnified views of the indicated regions. Yellow box, flame cells of the tail. Blue box, the protonephridial tubule splits anterior to the point of tail bifurcation. Green box, the protonephridial tubule extends to the nephridiopore at the tip of the tail. Mid-level DIC optical section showing nephridiopore and tegumental structure at tip of tail. (C) Numerous reagents utilized in this study labeled portions of the flame cells providing useful tools for analyzing flame cell morphology. The ciliated tuft stained with various anti-tubulin antibodies (top row). Several lectins showed different staining patterns of the extracellular matrix surrounding the flame cell (middle row). Phospho-specific antibodies (bottom row) also labeled the flame cells: anti-phospho S/T labeled the ciliary rootlet and anti-phosopho Y labeled the flame cell barrel. Differential interference contrast optics also permit observation of flame cell morphology. (D and E) Portions of the protonephridial tubules in the head label with lectin sWGA. (D) Maximum intensity projection of dorsal focal planes showing sWGA labeling of protonephridial tubules (white arrows) leading from the anterior flame cell pair (yellow arrowheads). (E) Cross-section of a maximum intensity projection from animal in D showing the sWGA-labeled protonephridial tubules (arrows) positioned dorsal to the sWGA-labeled acetabular ducts. Abbreviations: Lens culinaris agglutinin (LCA), peanut agglutinin (PNA), Pisum sativum agglutinin (PSA), succinylated wheat germ agglutinin (sWGA). Scale bars, 10 µm. Anterior faces up in all panels.
Figure 4
Figure 4. The central nervous system of cercariae.
(A) Immunofluorescence with an anti-synapsin antibody that labels the cephalic ganglia and many peripheral neural structures. Below, synapsin labeling is shown together with phalloidin staining. (B) Maximum confocal projections generated from ventral, medial, or dorsal focal planes. Anatomical regions are given above and staining reagents are listed to the left. (C) Depth projection showing synapsin staining in the CNS. Ventral view is shown above and a lateral view is shown below. Scale shown below indicates color-coding of distances from the ventral surface. Abbreviations: Dorsal nerve cords (DNC), cephalic ganglia (CG), ventral nerve cords (VNC), lateral nerve cords (LNC). For the sake of simplicity we have not distinguished anteriorly projecting cords from dorsally projecting cords. (D) Single confocal section though the cephalic ganglia, showing the central neuropil surrounded by neuronal nuclei. (E) Confocal projection showing innervation between the cephalic ganglia and the musculature surrounding the anterior ducts of the acetabular glands (magenta arrowheads). Scale bars, 10 µm. Anterior faces left in panels A, B, and C and up in panels D and E.
Figure 5
Figure 5. The nervous system of the cercarial tail.
(A) Extensive neural projections within the tail visualized by β-tubulin immunostaining. Overlay with phalloidin and DAPI show the position of the nerves relative to the tail musculature and nuclei, respectively. (B) Superficial neural projections (green) laying outside muscle layer (magenta). Arrowhead indicates a sensory papilla. (C) Longitudinal nerve cord (white arrowhead) running along a longitudinal muscle within the tail. Scale bars, 10 µm. Anterior faces left in all panels.
Figure 6
Figure 6. Labeling of non-reproductive tissues in adult S. mansoni.
(A) Lectin PNA staining of the esophageal gland cells. Lectin sWGA labeling of cephalic ganglia and protonephridial ducts in a female. Image is a maximum intensity projection. (B) Lectin sWGA labeling of cephalic ganglia and non-ciliated protonephridial ducts of a male. Also shown is anti-acetylated α-tubulin staining the ciliated regions of the protonephridial system. Image is a maximum intensity projection. (C) Maximum intensity projection depicting anti-acetylated α-tubulin staining of the ciliated regions of the male protonephridial system, including the flame cells and the collecting ducts. Note that many secondary and tertiary ciliated ducts funnel into one of the two main collecting ducts that run along the longitudinal axis. (D) Maximum intensity projection of a protonephridial unit labeled with anti-acetylated α-tubulin and lectin sWGA. Anti-acetylated α-tubulin marks the ciliated flame cells and ducts, whereas sWGA labels non-ciliated tubules. Scale bars, 10 µm. Anterior faces to the upper left in panels A and B.
Figure 7
Figure 7. The male reproductive system.
(A) Staining with DAPI and phalloidin showing the male head and various parts of the male reproductive system. Inset, magnified view of male cirrus. Image represents a maximum intensity projection derived from tiled stacks. Anterior to left, dorsal towards top. (B) Single confocal plane showing a testes lobe stained with anti-acetylated α-tubulin, sWGA and DAPI. DAPI staining shows the nuclear morphology of cells in different stages of spermatogenesis and anti-acetylated α-tubulin (green) stains the flagella and cortical microtubules of sperm. sWGA stains tubular structures that could represent cytoplasmic bridges between cells in mitotic and/or meiotic stages of spermatogenesis. (C) Magnified view of panel B. Scale Bars, 10 µm.
Figure 8
Figure 8. The female reproductive system.
(A) Top, female labeled with DAPI and phalloidin to show various regions of the female reproductive system. Autofluorescence from the vitelline cells is shown in green; this autofluorescence served as a useful marker for the vitelline duct and its contents. Image represents tiled images of confocal sections from a single animal. Yellow and cyan boxes correspond to the regions of the seminal receptacle and the ootype/Mehlis' gland complex, respectively. These boxes are color coded to indicate the relative positions of the structures shown in either panels B (yellow bar in upper left) or C (cyan bar in upper left). (B) Left, anti-acetylated α-tubulin labeling microtubules of sperm present in the seminal receptacle. Right, large nuclei of oocytes in the ovary can be seen stained with DAPI to the left. Dashed line represents the position of the of muscle layer surrounding the ovary. Images are from mid-level maximum intensity projections. (C) Maximum intensity projections showing staining of the ootype (top, shown surrounding an egg) with sWGA and Mehlis' gland with PNA, sWGA and acetylated α-tubulin (bottom). Arrowheads indicate cytoplasmic projections of Mehlis' gland cells. (D) Magnified view of Mehlis' gland from panel C. Scale Bars, 10 µm. Anterior faces left in panel A and up in panels B, C and D.
Figure 9
Figure 9. The organ systems of miracidia.
(A) The miracidial surface is covered by motile cilia on the epidermal plates as well as multiciliated sensory papilla (arrowheads) visualized by staining for β-tubulin and DIC optics. (B) Mid-level confocal section showing microtubule meshwork of germ cells (asterisks). (C) Anti-phospho S/T strongly labels the terebratorium and epidermal ridges surrounding the first tier of epidermal plates. (D) Anti-phospho S/T also displayed a weaker circumferential banding pattern similar to circumferential muscle (top). Optical crossections indicate that the weak, superficial anti-phospho S/T labeling is at the level of circumferential muscles (arrowhead) but not longitudinal muscles (arrows). (E) Similar to cercariae, anti-phospho S/T strongly labels the base of flame cells (arrowheads) in miracidia. (F and G) Immunofluorescence with an anti-synapsin antibody labels the cephalic ganglia and peripheral nerve structures. (F) Mid-level confocal section showing labeling of neuropil of the cephalic ganglia with anti-synapsin (green). The neuronal cell bodies of the cephalic ganglia contain small nuclei that stain intensely with DAPI (grey) and surround the neuropil. Phalloidin staining (magenta) labels the muscle as well as flame cells. (G) Maximum intensity projection of a miracidium stained with anti-synapsin antibody. Abbreviations: Cephalic ganglia (CG), nerve cords (NC). (H) Volume rendering of miracidium stained with PNA showing labeling of lateral glands and ducts. Scale Bars, 10 µm. Anterior faces left in all panels except C that represents a view from the anterior surface.

Similar articles

Cited by

References

    1. Chitsulo L, Engels D, Montresor A, Savioli L. The global status of schistosomiasis and its control. Acta Trop. 2000;77:41–51. - PMC - PubMed
    1. Basch PF. New York: Oxford University Press; 1991. Schistosomes: Development, Reproduction, and Host Relations.248
    1. Freitas TC, Jung E, Pearce EJ. TGF-beta signaling controls embryo development in the parasitic flatworm Schistosoma mansoni. PLoS Pathog. 2007;3:e52. - PMC - PubMed
    1. Rinaldi G, Morales ME, Alrefaei YN, Cancela M, Castillo E, et al. RNA interference targeting leucine aminopeptidase blocks hatching of Schistosoma mansoni eggs. Mol Biochem Parasitol. 2009;167:118–126. - PMC - PubMed
    1. Skelly PJ, Da'dara A, Harn DA. Suppression of cathepsin B expression in Schistosoma mansoni by RNA interference. Int J Parasitol. 2003;33:363–369. - PubMed

Publication types