

HLA DNA sequence variation among human populations: molecular signatures of demographic and selective events
- PMID: 21408106
- PMCID: PMC3051395
- DOI: 10.1371/journal.pone.0014643
HLA DNA sequence variation among human populations: molecular signatures of demographic and selective events
Abstract
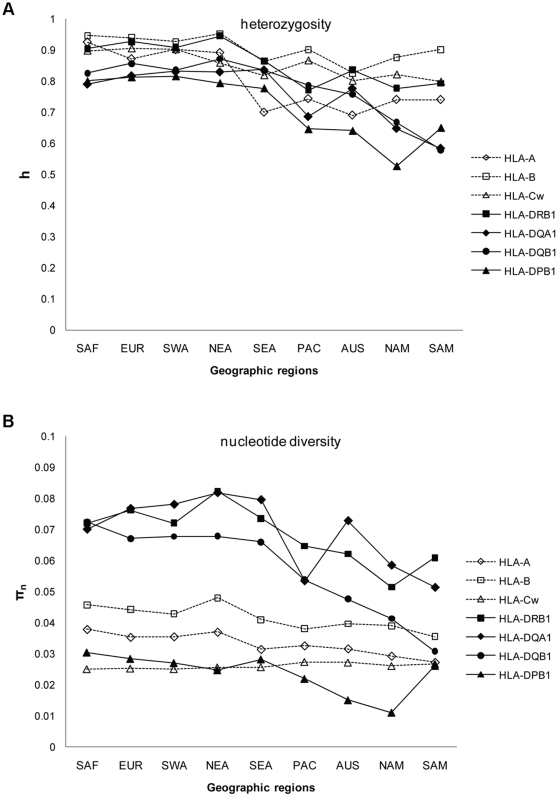
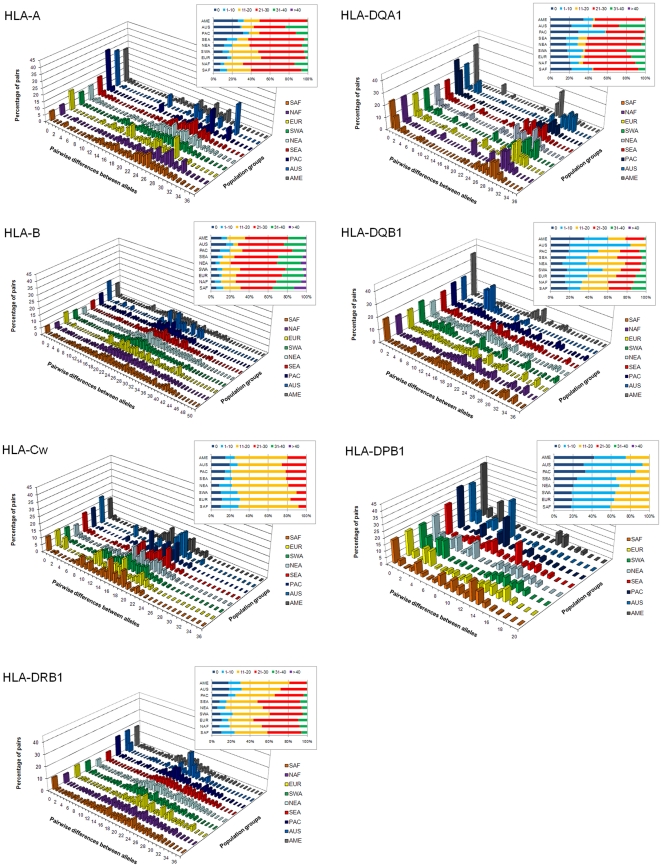
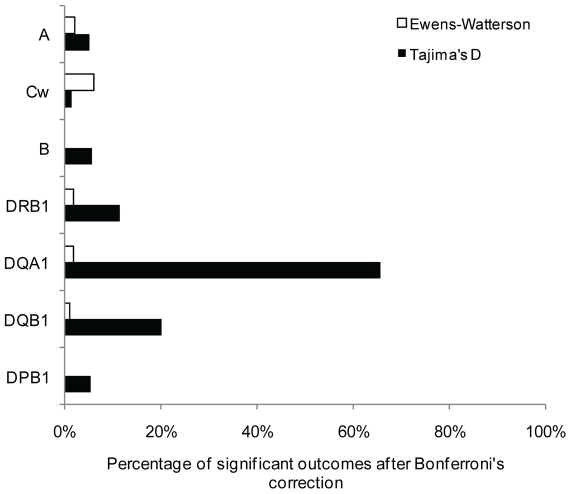
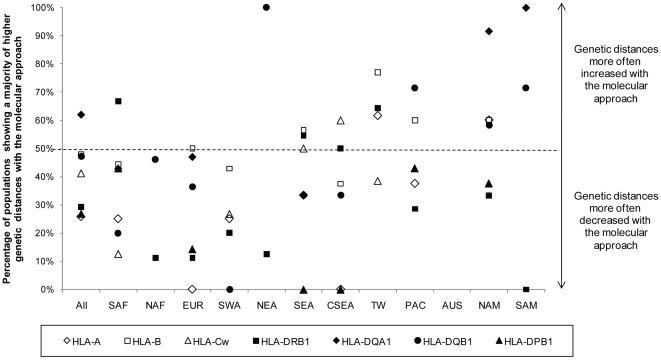
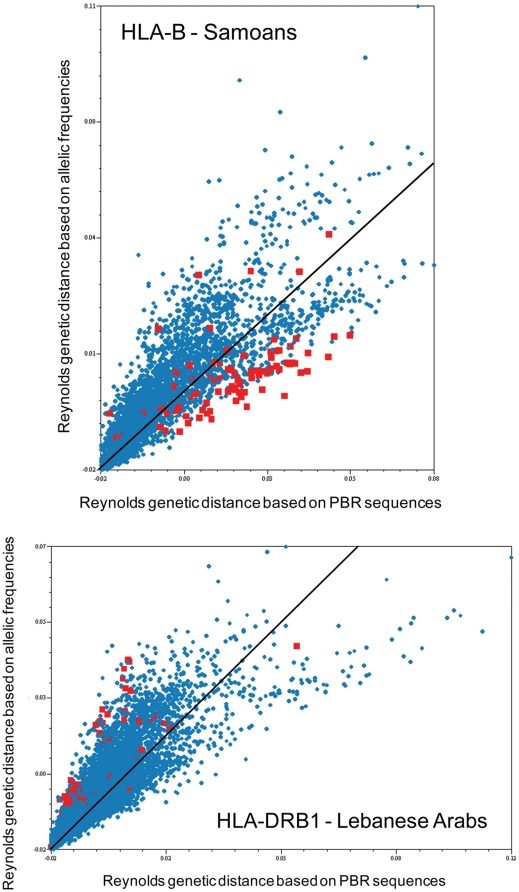
Molecular differences between HLA alleles vary up to 57 nucleotides within the peptide binding coding region of human Major Histocompatibility Complex (MHC) genes, but it is still unclear whether this variation results from a stochastic process or from selective constraints related to functional differences among HLA molecules. Although HLA alleles are generally treated as equidistant molecular units in population genetic studies, DNA sequence diversity among populations is also crucial to interpret the observed HLA polymorphism. In this study, we used a large dataset of 2,062 DNA sequences defined for the different HLA alleles to analyze nucleotide diversity of seven HLA genes in 23,500 individuals of about 200 populations spread worldwide. We first analyzed the HLA molecular structure and diversity of these populations in relation to geographic variation and we further investigated possible departures from selective neutrality through Tajima's tests and mismatch distributions. All results were compared to those obtained by classical approaches applied to HLA allele frequencies.Our study shows that the global patterns of HLA nucleotide diversity among populations are significantly correlated to geography, although in some specific cases the molecular information reveals unexpected genetic relationships. At all loci except HLA-DPB1, populations have accumulated a high proportion of very divergent alleles, suggesting an advantage of heterozygotes expressing molecularly distant HLA molecules (asymmetric overdominant selection model). However, both different intensities of selection and unequal levels of gene conversion may explain the heterogeneous mismatch distributions observed among the loci. Also, distinctive patterns of sequence divergence observed at the HLA-DPB1 locus suggest current neutrality but old selective pressures on this gene. We conclude that HLA DNA sequences advantageously complement HLA allele frequencies as a source of data used to explore the genetic history of human populations, and that their analysis allows a more thorough investigation of human MHC molecular evolution.
Conflict of interest statement
Figures
References
-
- Bunce M, Young N, Welsh K. Molecular HLA typing-the brave new world. Transplantation. 1997;64:1505–1513. - PubMed
-
- Marsh S, Parham P, Barber L. The HLA FactsBook. Academic Press; 2000. 398
-
- Mytilineos J, Christ U, Lempert M, Opelz G. Comparison of typing results by serology and polymerase chain reaction with sequence-specific primers for HLA-Cw in 650 individuals. Tissue Antigens. 1997;50:395–400. - PubMed
-
- Bunce M, Barnardo M, Procter J, Marsh S, Vilches C, et al. High resolution HLA-C typing by PCR-SSP: identification of allelic frequencies and linkage disequilibria in 604 unrelated random UK Caucasoïds and a comparison with serology. Tissue Antigens. 1997;50:100–111. - PubMed
-
- Grundschober C, Rufer N, Sanchez-Mazas A, Madrigal A, Jeannet M, et al. Molecular characterization of HLA-C incompatibilities in HLA-ABDR-matched unrelated bone marrow donor-recipient pairs. Tissue Antigens. 1997;49:612–623. - PubMed
Publication types
MeSH terms
Substances
LinkOut - more resources
Full Text Sources
Other Literature Sources
Research Materials
