. 2011 Mar 8;6(3):e17445.
doi: 10.1371/journal.pone.0017445.

Network theory analysis of antibody-antigen reactivity data: the immune trees at birth and adulthood

Affiliations

Network theory analysis of antibody-antigen reactivity data: the immune trees at birth and adulthood

Asaf Madi et al. PLoS One. .

Abstract

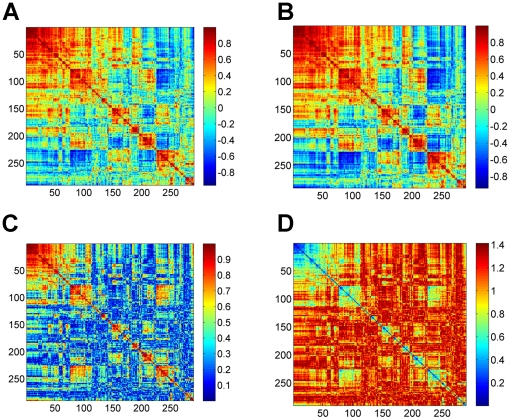
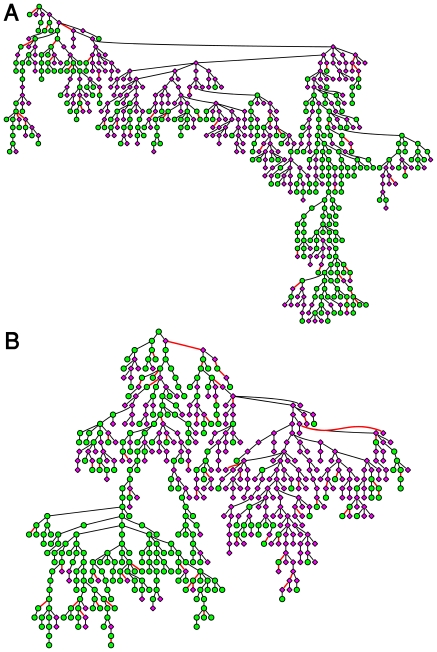
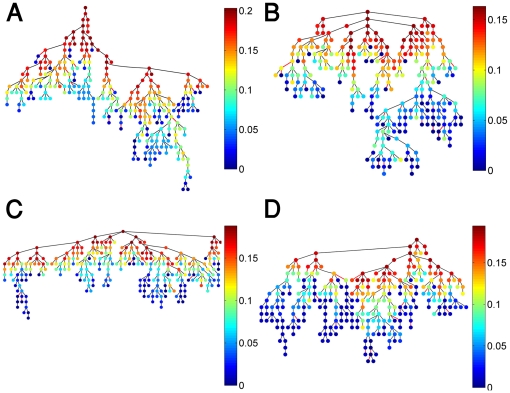
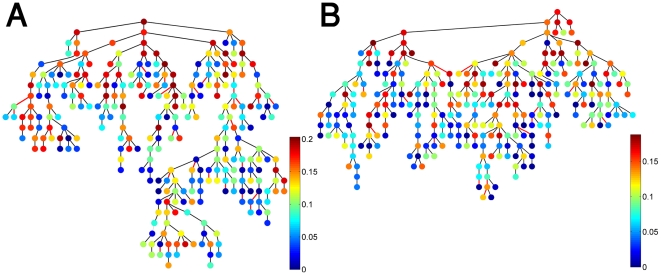
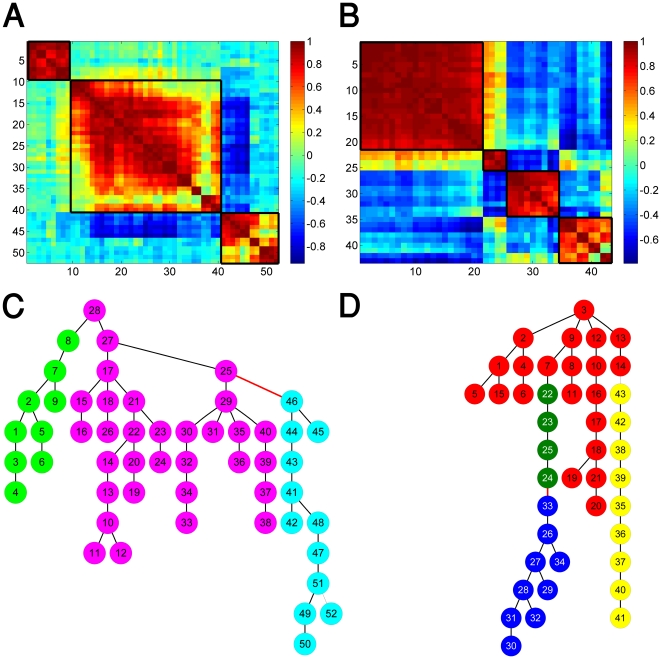
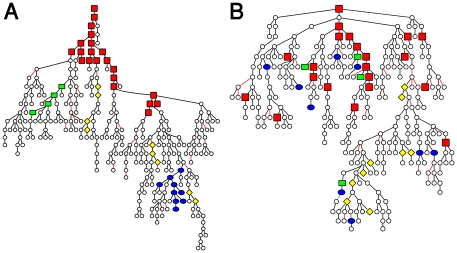
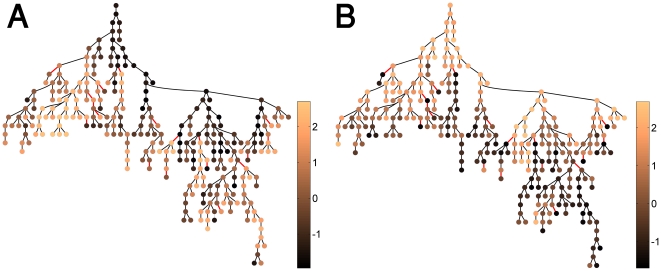
Motivation: New antigen microarray technology enables parallel recording of antibody reactivities with hundreds of antigens. Such data affords system level analysis of the immune system's organization using methods and approaches from network theory. Here we measured the reactivity of 290 antigens (for both the IgG and IgM isotypes) of 10 healthy mothers and their term newborns. We constructed antigen correlation networks (or immune networks) whose nodes are the antigens and the edges are the antigen-antigen reactivity correlations, and we also computed their corresponding minimum spanning trees (MST)--maximal information reduced sub-graphs. We quantify the network organization (topology) in terms of the network theory divergence rate measure and rank the antigen importance in the full antigen correlation networks by the eigen-value centrality measure. This analysis makes possible the characterization and comparison of the IgG and IgM immune networks at birth (newborns) and adulthood (mothers) in terms of topology and node importance.

Results: Comparison of the immune network topology at birth and adulthood revealed partial conservation of the IgG immune network topology, and significant reorganization of the IgM immune networks. Inspection of the antigen importance revealed some dominant (in terms of high centrality) antigens in the IgG and IgM networks at birth, which retain their importance at adulthood.


Conflict of interest statement

Competing Interests: Eshel Ben-Jacob is a PLoS ONE Academic Editor.

Figures

Figure 1
Figure 1. The process of transforming antigen-reactivity correlations into correlation-based distance: (A) correlation matrix; (B) normalized correlation matrix; (C) absolute value of the normalized correlation matrix after transformation to the range of (−1,1); and (D) distance matrix.
The matrices presented here are for the mothers' IgM dataset. We note that for visualization proposes, the original correlation matrix (A) was reordered using the dendrogram algorithm, while all other matrices were reordered according to it.
Figure 2
Figure 2. The IgM-IgG merged Minimal Spanning Trees.
(A) The merged MST for the mothers. (B) The merged MST for the cords. The green (ellipse) and purple (diamond) nodes represent the IgG and IgM isotypes respectively. Negative correlations between two nodes are indicated by red lines.
Figure 3
Figure 3. Hierarchical organization of the separated immune trees for the IgM and IgG isotypes.
(A) The MST for of the maternal IgM; (B) The MST of the cords' IgM; (C) The MST of the maternal IgG; and (D) The MST of the cords' IgG. The nodes' colors indicate their centrality level from dark red for high centrality to dark blue for low centrality. The first node in the trees is the one with the highest centrality. Negative correlations between nodes are designated by red edges and constitute about 7–10% of the links.
Figure 4
Figure 4. Centrality comparison between the immune networks of mothers and cords.
In (A) and (B) we re-plot the cords' immune trees for the IgM and IgG shown in Figures 3B and 3D, while coloring the nodes according to the centrality calculated for the maternal IgM and IgG immune trees shown in Figures 3A and 3C.
Figure 5
Figure 5. Immune trees of the immune cliques.
The correlation matrices for the antigens that belong to the immune cliques identified in (Madi, et al., 2009), are shown in (A) for the maternal IgG isotypes and (B) for the maternal IgM isotypes. The corresponding immune trees for the maternal IgG cliques and the maternal IgM cliques are shown in (C) and (D), respectively. Note that the nodes colored green, purple and cyan in panel C correspond to the top left, middle and lower right clusters in panel A. The nodes colored red, green, blue and yellow in panel D correspond to the four clusters (from top left to bottom right) in panel B.
Figure 6
Figure 6. The clique association of the nodes on the immune trees.
(A) The clique locations for the maternal IgM tree. The cliques association of the nodes is marked on the trees using different shapes and colors: clique 1 – red square, clique 2 – blue ellipse, clique 3 – dark green rectangle and clique 4 – yellow diamond. Note that although most of the cliques appear to be linked in the MST presentation, some were not linked, probably due to the loss of information in the dimension reduction process. (B) The clique locations on the cords' IgM tree. Panel B shows that maternal clique members are scattered in the network according to the cord dataset.
Figure 7
Figure 7. Individual immune trees.
Hierarchical graph representations of two individual mother immune networks superimposed on the maternal IgM group dataset, as was presented in Figure 4A. The nodes are colored according to normalized antigen reactivity levels for two selected mothers, (A) and (B), from the most reactive node (light brown) to the least reactive nodes (dark brown). Note that the first nodes in each of the MSTs have high centrality value, as was shown previously in Figure 3.

References

    1. Quintana FJ, Cohen IR. The natural autoantibody repertoire and autoimmune disease. Biomed Pharmacother. 2004;58:276–281. - PubMed
    1. Quintana FJ, Hagedorn PH, Elizur G, Merbl Y, Domany E, et al. Functional immunomics: microarray analysis of IgG autoantibody repertoires predicts the future response of mice to induced diabetes. Proc Natl Acad Sci U S A. 2004;101(Suppl 2):14615–14621. - PMC - PubMed
    1. Robinson WH. Antigen arrays for antibody profiling. Curr Opin Chem Biol. 2006;10:67–72. - PubMed
    1. Madi A, Hecht I, Bransburg-Zabary S, Merbl Y, Pick A, et al. Organization of the autoantibody repertoire in healthy newborns and adults revealed by system level informatics of antigen microarray data. Proc Natl Acad Sci U S A. 2009;106:14484–14489. - PMC - PubMed
    1. Mantegna RN, Stanley HE. Cambridge UK: Cambridge University Press; 2000. An Introduction to Econophysics: Correlations and Complexity in Finance.

Publication types