. 2011 Mar 7;6(3):e17388.
doi: 10.1371/journal.pone.0017388.

Azacytidine and decitabine induce gene-specific and non-random DNA demethylation in human cancer cell lines

Affiliations

Azacytidine and decitabine induce gene-specific and non-random DNA demethylation in human cancer cell lines

Sabine Hagemann et al. PLoS One. .

Abstract

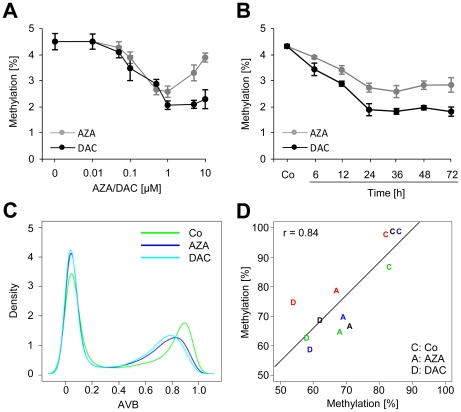
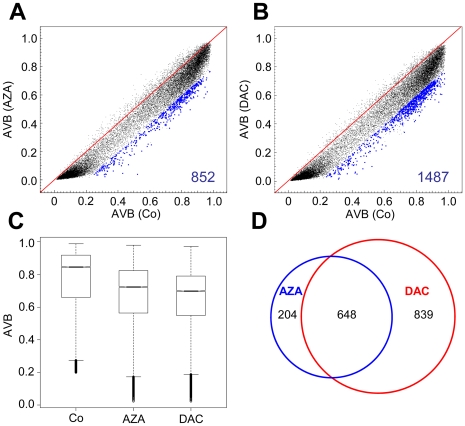
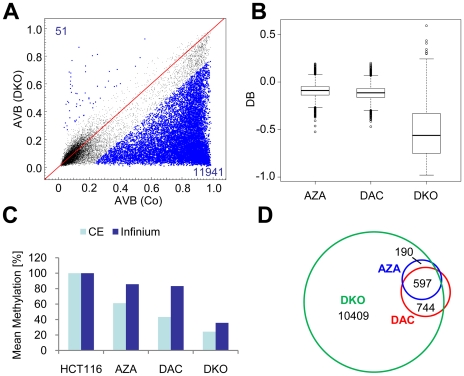
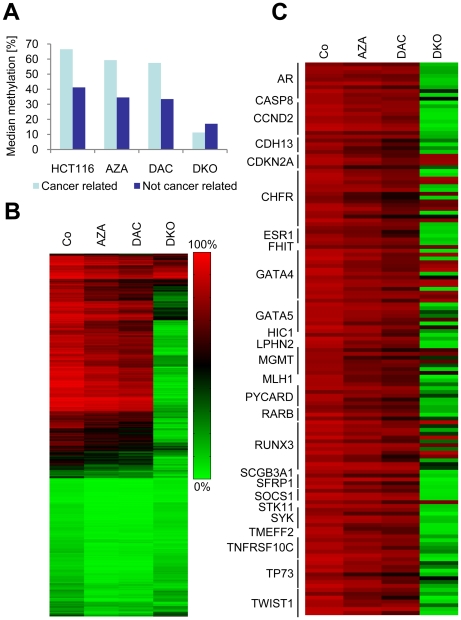
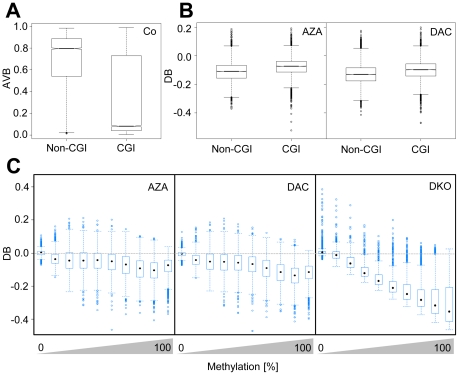
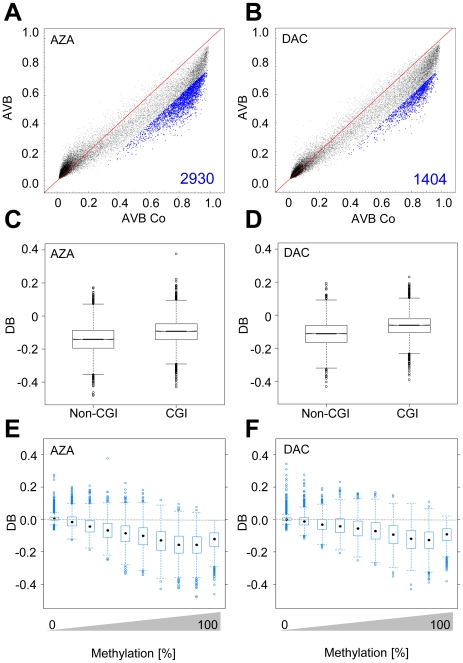
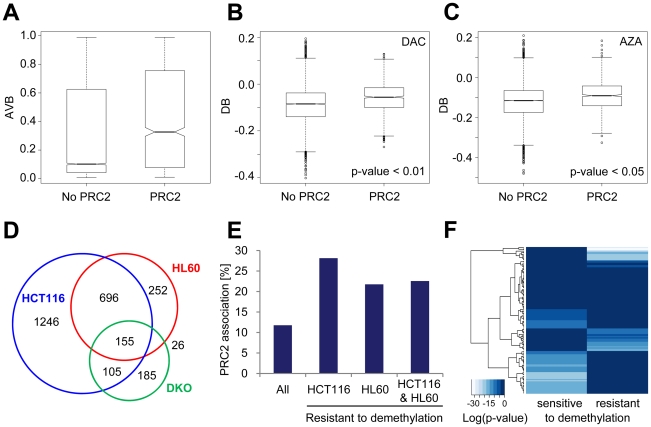
The DNA methyltransferase inhibitors azacytidine and decitabine represent archetypal drugs for epigenetic cancer therapy. To characterize the demethylating activity of azacytidine and decitabine we treated colon cancer and leukemic cells with both drugs and used array-based DNA methylation analysis of more than 14,000 gene promoters. Additionally, drug-induced demethylation was compared to methylation patterns of isogenic colon cancer cells lacking both DNA methyltransferase 1 (DNMT1) and DNMT3B. We show that drug-induced demethylation patterns are highly specific, non-random and reproducible, indicating targeted remethylation of specific loci after replication. Correspondingly, we found that CG dinucleotides within CG islands became preferentially remethylated, indicating a role for DNA sequence context. We also identified a subset of genes that were never demethylated by drug treatment, either in colon cancer or in leukemic cell lines. These demethylation-resistant genes were enriched for Polycomb Repressive Complex 2 components in embryonic stem cells and for transcription factor binding motifs not present in demethylated genes. Our results provide detailed insights into the DNA methylation patterns induced by azacytidine and decitabine and suggest the involvement of complex regulatory mechanisms in drug-induced DNA demethylation.


Conflict of interest statement

Competing Interests: The authors have declared that no competing interests exist.

Figures

Figure 1
Figure 1. Genome-wide methylation analysis of HCT116 cells.
A, Global methylation analysis (CE) of HCT116 cells treated with the indicated concentrations of AZA and DAC for 24 h. B, Time-course CE measurement of drug-induced demethylation using 1 µM AZA or DAC; Co, untreated HCT116 cells. C, Kernel density estimates of Infinium methylation data for untreated (Co) and drug-treated cells. D, Validation of Infinium methylation data using 454 bisulfite sequencing; methylation data of 4 CG loci, measured either by Infinium analysis or by 454 sequencing, correlate strongly (Pearson's correlation coefficient r  = 0.84); treatment with AZA and DAC is indicated by A and D, respectively; different loci are indicated by colors: PIK3CG (blue), NTRK3 (green), Ells1 (red), and AFF2 (black).
Figure 2
Figure 2. AZA and DAC induce non-random demethylation patterns in HCT116 cells.
Methylation changes in HCT116 cells treated for 24 h with AZA (A) or DAC (B); blue dots and numbers represent demethylated CGs (DB≤−0.2). C, Boxplots show the distribution of methylated CGs in HCT116 control samples and cells treated with AZA or DAC; black lines denote medians, notches the standard errors, boxes the interquartile range, and whiskers the 2.5th and 97.5th percentiles. D, Venn diagrams indicate overlapping demethylated CGs in drug-treated cells.
Figure 3
Figure 3. The majority of CGs resistant to drug-induced demethylation become demethylated in DKO cells.
A, DKO cells show substantial differences to HCT116 cells in their methylation pattern; blue dots and numbers represent demethylated or hypermethylated CGs (DB≤−0.2 or ≥0.2). B, Boxplots show the demethylation (DB) in drug-treated HCT16 cells and DKO cells; black lines denote medians, notches the standard errors, boxes the interquartile range, and whiskers the 2.5th and 97.5th percentiles. C, Comparison of relative mean methylation of drug-treated cells and DKO cells as determined by global genomic methylation analysis (CE) and Infinium methylation analysis. D, Venn diagrams indicate overlapping demethylated CGs between drug-treated cells and DKO cells.
Figure 4
Figure 4. Hypermethylated cancer-associated genes and tumor suppressor genes are strongly demethylated in DKO cells.
A, Median methylation levels of cancer-related and non-cancer-related CGs in untreated cells (Co), drug-treated cells (AZA, DAC) and DKO cells. B, Heatmap of CG methylation in cancer-associated genes. C, Heatmap of hypermethylated bona fide tumor suppressor-genes in drug-treated and DNMT knockout cells.
Figure 5
Figure 5. Highly methylated CGs and CGs outside of CG islands are preferentially demethylated in HCT116 cells.
A, Boxplots indicate differences in methylation between CGIs and non-CGIs. B, Boxplots show demethylation efficiency indicated by DB values in AZA- and DAC-treated HCT116 cells dependent on CG association with CGIs. For A and B, black lines denote medians, notches the standard errors, boxes the interquartile range, and whiskers the 2.5th and 97.5th percentiles. C, Boxplots show demethylation efficiencies as a function of degree of CG-methylation in AZA- and DAC-treated HCT116 cells. Methylation levels were grouped in 10% intervals from 0 to 100% methylation; black marks denote medians, boxes the interquartile range, and whiskers the 2.5th and 97.5th percentiles.
Figure 6
Figure 6. Drug-induced demethylation patterns in HL60 myeloid leukemia cells.
Methylation changes in HL60 cells treated for 24 h with AZA (A) or DAC (B); blue dots and numbers represent demethylated CGs (DB≤−0.2). C, D, Boxplots show demethylation efficiency indicated by DB values in AZA- and DAC-treated HCT116 cells dependent on CG association with CGIs; black lines denote medians, notches the standard errors, boxes the interquartile range, and whiskers the 2.5th and 97.5th percentiles. Boxplots show demethylation efficiencies as a function of degree of CG methylation in E, AZA- and F, DAC-treated HL60 cells. Methylation levels were grouped in 10% intervals from 0 to 100% methylation; black marks denote medians, boxes the interquartile range, and whiskers the 2.5th and 97.5th percentiles.
Figure 7
Figure 7. The chromatin environment may modify drug-induced demethylation efficiency.
A, Boxplots show the distribution of CG methylation in PRC2-associated CGs and non-PRC2-associated CGs in HL60 cells. B, C, Boxplots show demethylation efficiency indicated by DB values in AZA- and in DAC-treated HL60 cells dependent on association with PRC2 components. For A, B, and C black lines denote medians, notches the standard errors, boxes the interquartile range, and whiskers the 2.5th and 97.5th percentiles. D, Venn diagrams indicate CGs which did not become demethylated (AVB≥0.8) in drug treated HCT116 and HL60 cells and in DKO cells, respectively. E, Percentage of demethylation-resistant CGs associated with PRC2 components in HCT116 and HL60 cells, and for overlapping CGs of both cell lines (HCT116 & HL60). F, Significance of enrichment of transcription factor binding sites in genes with demethylation-resistant CGs in HCT116 and HL60 cells and with CGs that became demethylated by AZA and DAC in HCT116 and HL60 cells (sensitive to demethylation). Heatmap columns represent log (P values) for enrichment of 130 transcription factors.

References

    1. Jones PA, Baylin SB. The fundamental role of epigenetic events in cancer. Nat Rev Genet. 2002;3:415–428. - PubMed
    1. Robertson KD. DNA methylation and human disease. Nat Rev Genet. 2005;6:597–610. - PubMed
    1. Jones PA, Baylin SB. The epigenomics of cancer. Cell. 2007;128:683–692. - PMC - PubMed
    1. Sakai T, Toguchida J, Ohtani N, Yandell DW, Rapaport JM, et al. Allele-specific hypermethylation of the retinoblastoma tumor-suppressor gene. Am J Hum Genet. 1991;48:880–888. - PMC - PubMed
    1. Herman JG, Latif F, Weng Y, Lerman MI, Zbar B, et al. Silencing of the VHL tumor-suppressor gene by DNA methylation in renal carcinoma. Proc Natl Acad Sci U S A. 1994;91:9700–9704. - PMC - PubMed

Publication types

MeSH terms