

Age-related changes of neuron numbers in the frontal cortex of a transgenic mouse model of Alzheimer's disease
- PMID: 21409417
- PMCID: PMC3155024
- DOI: 10.1007/s00429-011-0305-1
Age-related changes of neuron numbers in the frontal cortex of a transgenic mouse model of Alzheimer's disease
Abstract
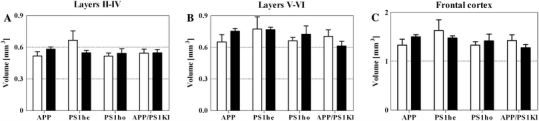
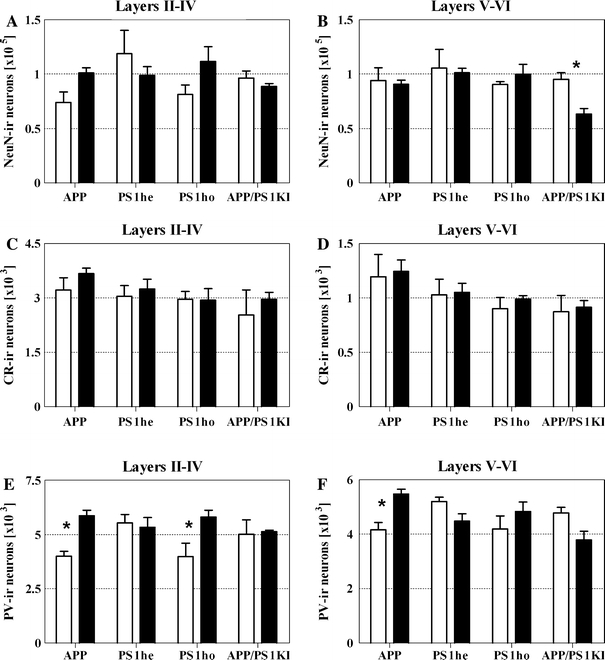
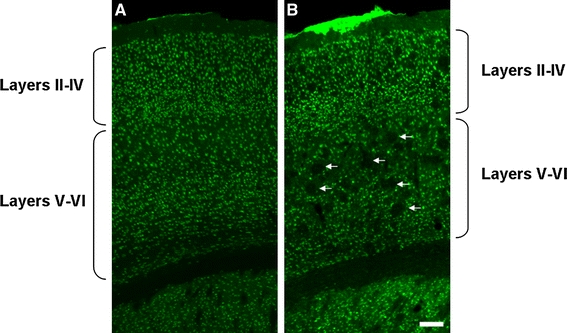
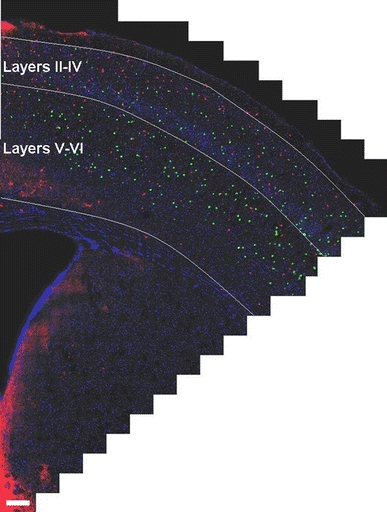
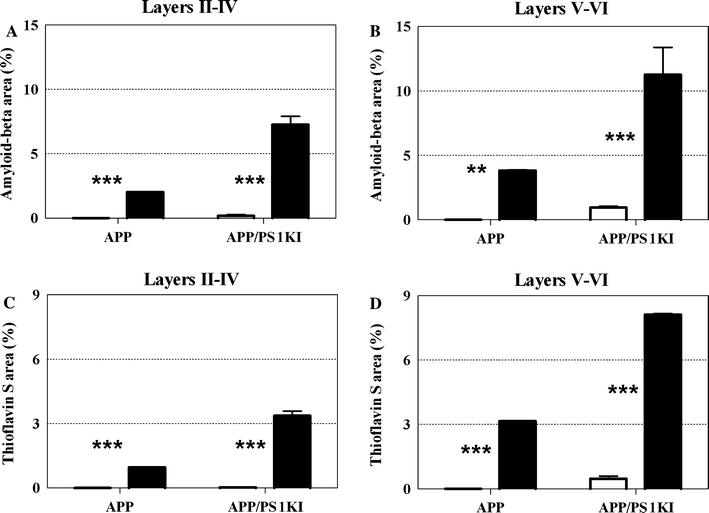
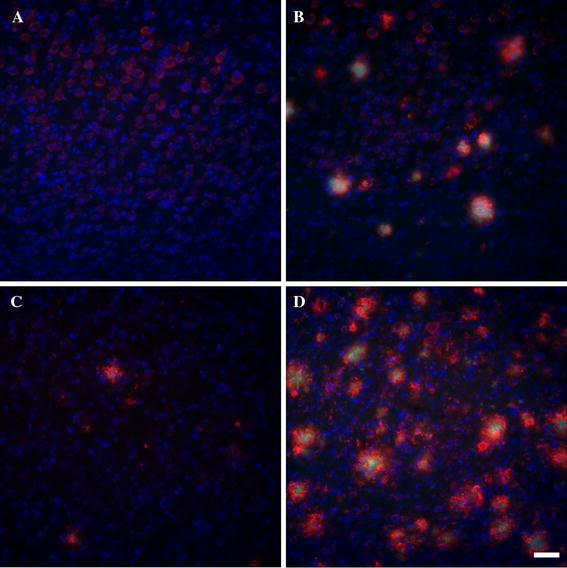
Alzheimer's disease (AD) is a neurodegenerative disorder, characterized by amyloid plaque accumulation, intracellular tangles and neuronal loss in selective brain regions. The frontal cortex, important for executive functioning, is one of the regions that are affected. Here, we investigated the neurodegenerative effects of mutant human amyloid precursor protein (APP) and presenilin 1 (PS1) on frontal cortex neurons in APP/PS1KI mice, a transgenic mouse model of AD, expressing two mutations in the human APP, as well as two human PS1 mutations knocked-in into the mouse PS1 gene in a homozygous (ho) manner. Although the hippocampus is significantly affected in these mice, very little is known about the effects of these mutations on selective neuronal populations and plaque load in the frontal cortex. In this study, cytoarchitectural changes were characterized using high precision design-based stereology to evaluate plaque load, total neuron numbers, as well as total numbers of parvalbumin- (PV) and calretinin- (CR) immunoreactive (ir) neurons in the frontal cortex of 2- and 10-month-old APP/PS1KI mice. The frontal cortex was divided into two subfields: layers II-IV and layers V-VI, the latter of which showed substantially more extracellular amyloid-beta aggregates. We found a 34% neuron loss in layers V-VI in the frontal cortex of 10-month-old APP/PS1KI mice compared to 2-month-old, while there was no change in PV- and CR-ir neurons in these mice. In addition, the plaque load in layers V-VI of 10-month-old APP/PS1KI mice was only 11% and did not fully account for the extent of neuronal loss. Interestingly, an increase was found in the total number of PV-ir neurons in all frontal cortical layers of single transgenic APP mice and in layers II-IV of single transgenic PS1ho mice between 2 and 10 months of age. In conclusion, the APP/PS1KI mice provide novel insights into the regional selective vulnerability in the frontal cortex during AD that, together with previous findings in the hippocampus, are remarkably similar to the human situation.
Figures
Similar articles
-
Transient intraneuronal A beta rather than extracellular plaque pathology correlates with neuron loss in the frontal cortex of APP/PS1KI mice.Acta Neuropathol. 2008 Dec;116(6):647-55. doi: 10.1007/s00401-008-0451-6. Epub 2008 Oct 31. Acta Neuropathol. 2008. PMID: 18974993
-
Gene Expression Profiling in the APP/PS1KI Mouse Model of Familial Alzheimer's Disease.J Alzheimers Dis. 2016;50(2):397-409. doi: 10.3233/JAD-150745. J Alzheimers Dis. 2016. PMID: 26639971
-
Inflammatory changes are tightly associated with neurodegeneration in the brain and spinal cord of the APP/PS1KI mouse model of Alzheimer's disease.Neurobiol Aging. 2010 May;31(5):747-57. doi: 10.1016/j.neurobiolaging.2008.06.011. Epub 2008 Jul 26. Neurobiol Aging. 2010. PMID: 18657882
-
Review on the APP/PS1KI mouse model: intraneuronal Abeta accumulation triggers axonopathy, neuron loss and working memory impairment.Genes Brain Behav. 2008 Feb;7 Suppl 1:6-11. doi: 10.1111/j.1601-183X.2007.00372.x. Genes Brain Behav. 2008. PMID: 18184366 Review.
-
Genome instability in Alzheimer disease.Mech Ageing Dev. 2017 Jan;161(Pt A):83-94. doi: 10.1016/j.mad.2016.04.005. Epub 2016 Apr 20. Mech Ageing Dev. 2017. PMID: 27105872 Free PMC article. Review.
Cited by
-
Loss of Hippocampal Calretinin and Parvalbumin Interneurons in the 5XFAD Mouse Model of Alzheimer's Disease.ASN Neuro. 2020 Jan-Dec;12:1759091420925356. doi: 10.1177/1759091420925356. ASN Neuro. 2020. PMID: 32423230 Free PMC article.
-
Adipose-derived mesenchymal stem cell transplantation promotes adult neurogenesis in the brains of Alzheimer's disease mice.Neural Regen Res. 2014 Apr 15;9(8):798-805. doi: 10.4103/1673-5374.131596. Neural Regen Res. 2014. PMID: 25206892 Free PMC article.
-
Cellular correlates of gray matter volume changes in magnetic resonance morphometry identified by two-photon microscopy.Sci Rep. 2021 Feb 19;11(1):4234. doi: 10.1038/s41598-021-83491-8. Sci Rep. 2021. PMID: 33608622 Free PMC article.
-
Regional and sub-regional differences in hippocampal GABAergic neuronal vulnerability in the TgCRND8 mouse model of Alzheimer's disease.Front Aging Neurosci. 2015 Mar 24;7:30. doi: 10.3389/fnagi.2015.00030. eCollection 2015. Front Aging Neurosci. 2015. PMID: 25852545 Free PMC article.
-
REGION-SPECIFIC NEURON AND SYNAPSE LOSS IN THE HIPPOCAMPUS OF APPSL/PS1 KNOCK-IN MICE.Transl Neurosci. 2013 Mar 1;4(1):8-19. doi: 10.2478/s13380-013-0111-8. Transl Neurosci. 2013. PMID: 24829793 Free PMC article.
References
-
- Bayer TA, Wirths O. Review on the APP/PS1KI mouse model: intraneuronal Abeta accumulation triggers axonopathy, neuron loss and working memory impairment. Genes Brain Behav. 2008;7(Suppl 1):6–11. - PubMed
Publication types
MeSH terms
Substances
LinkOut - more resources
Full Text Sources
Medical
