

UV resonance Raman finds peptide bond-Arg side chain electronic interactions
- PMID: 21410150
- PMCID: PMC3088768
- DOI: 10.1021/jp112174s
UV resonance Raman finds peptide bond-Arg side chain electronic interactions
Abstract
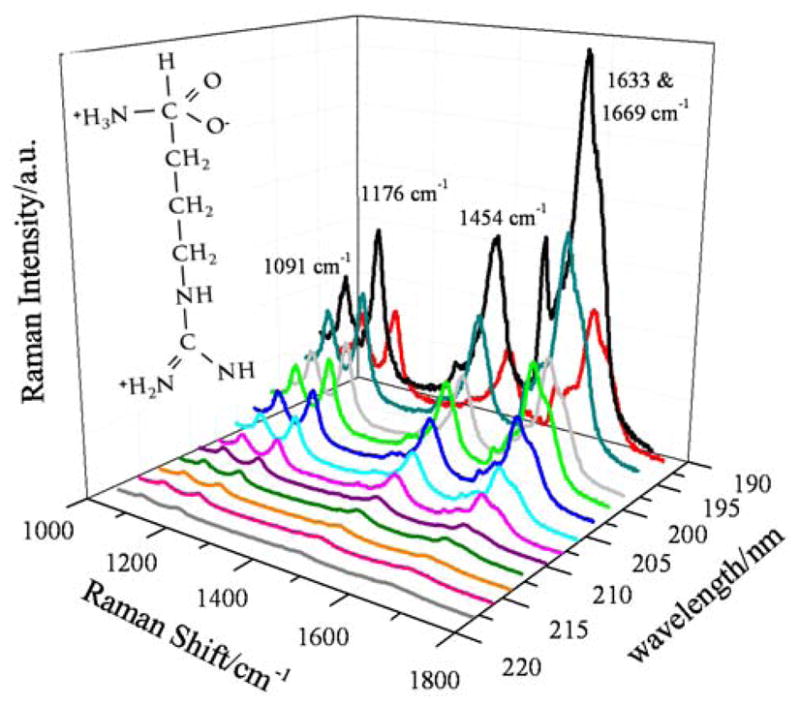
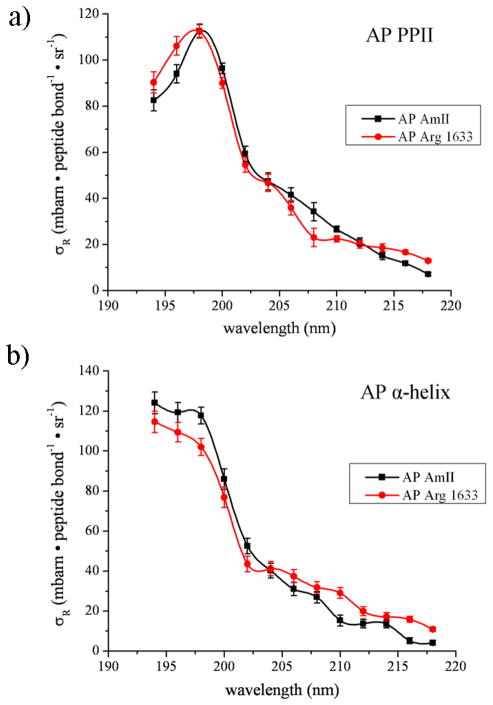
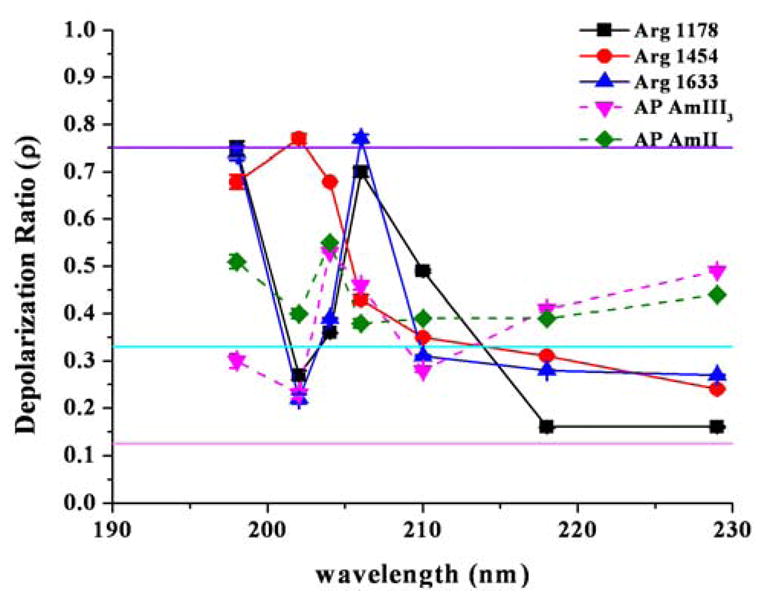
We measured the UV resonance Raman excitation profiles and Raman depolarization ratios of the arginine (Arg) vibrations of the amino acid monomer as well as Arg in the 21-residue predominantly alanine peptide AAAAA(AAARA)(3)A (AP) between 194 and 218 nm. Excitation within the π → π* peptide bond electronic transitions result in UVRR spectra dominated by amide peptide bond vibrations. The Raman cross sections and excitation profiles indicate that the Arg side chain electronic transitions mix with the AP peptide bond electronic transitions. The Arg Raman bands in AP exhibit Raman excitation profiles similar to those of the amide bands in AP which are conformation specific. These Arg excitation profiles distinctly differ from the Arg monomer. The Raman depolarization ratios of Arg in monomeric solution are quite simple with ρ = 0.33 indicating enhancement by a single electronic transition. In contrast, we see very complex depolarization ratios of Arg in AP that indicate that the Arg residues are resonance enhanced by multiple electronic transitions.
Figures


Similar articles
-
UV resonance Raman and DFT studies of arginine side chains in peptides: insights into arginine hydration.J Phys Chem B. 2013 Jun 20;117(24):7145-56. doi: 10.1021/jp404030u. Epub 2013 Jun 5. J Phys Chem B. 2013. PMID: 23676082 Free PMC article.
-
UV resonance raman investigation of electronic transitions in alpha-helical and polyproline II-like conformations.J Phys Chem B. 2008 Sep 18;112(37):11762-9. doi: 10.1021/jp801110q. Epub 2008 Aug 20. J Phys Chem B. 2008. PMID: 18712913 Free PMC article.
-
UV resonance Raman investigation of the conformations and lowest energy allowed electronic excited states of tri- and tetraalanine: charge transfer transitions.J Phys Chem B. 2010 May 20;114(19):6661-8. doi: 10.1021/jp100428n. J Phys Chem B. 2010. PMID: 20420366 Free PMC article.
-
UV Raman studies of peptide conformation demonstrate that betanova does not cooperatively unfold.Biochemistry. 2001 Nov 13;40(45):13723-7. doi: 10.1021/bi011505k. Biochemistry. 2001. PMID: 11695921
-
Uncoupled peptide bond vibrations in alpha-helical and polyproline II conformations of polyalanine peptides.J Phys Chem B. 2005 Feb 24;109(7):3047-52. doi: 10.1021/jp0460442. J Phys Chem B. 2005. PMID: 16851319
Cited by
-
NGIWY-Amide: A Bioinspired Ultrashort Self-Assembled Peptide Gelator for Local Drug Delivery Applications.Pharmaceutics. 2022 Jan 6;14(1):133. doi: 10.3390/pharmaceutics14010133. Pharmaceutics. 2022. PMID: 35057029 Free PMC article.
-
UV resonance Raman and DFT studies of arginine side chains in peptides: insights into arginine hydration.J Phys Chem B. 2013 Jun 20;117(24):7145-56. doi: 10.1021/jp404030u. Epub 2013 Jun 5. J Phys Chem B. 2013. PMID: 23676082 Free PMC article.
References
-
- Barnes DG, Rhodes W. J Chim Phys. 1968;48:817. - PubMed
-
- Basch H, Robin MB, Kuebler NA. J Chem Phys. 1967;47:1201.
-
- Basch H, Robin MB, Kuebler NA. J Chem Phys. 1968;49:5007.
-
- Johnson WC, Jr, Simpson WT. J Chem Phys. 1968;48:2168.
-
- Kaya K, Nagakura S. Theor Chim Acta. 1967;7:117.
Publication types
MeSH terms
Substances
Grants and funding
LinkOut - more resources
Full Text Sources
Research Materials
Miscellaneous
