. 2011 May;278(10):1699-712.
doi: 10.1111/j.1742-4658.2011.08096.x. Epub 2011 Apr 20.

Glycomics-based analysis of chicken red blood cells provides insight into the selectivity of the viral agglutination assay

Affiliations

Glycomics-based analysis of chicken red blood cells provides insight into the selectivity of the viral agglutination assay

Udayanath Aich et al. FEBS J. 2011 May.

Abstract

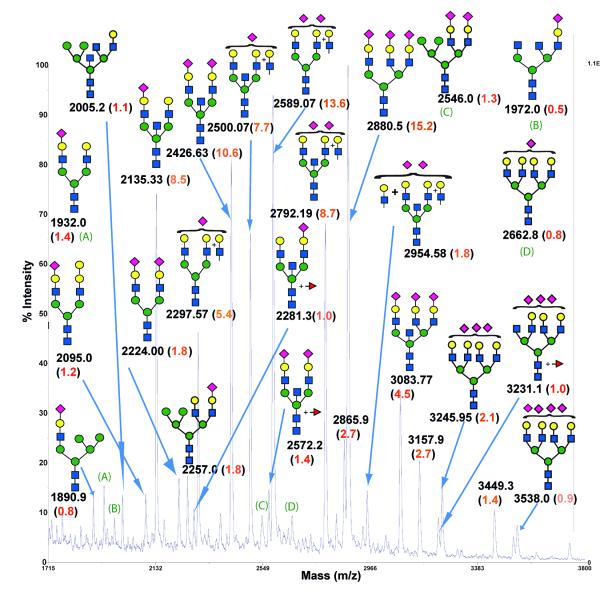
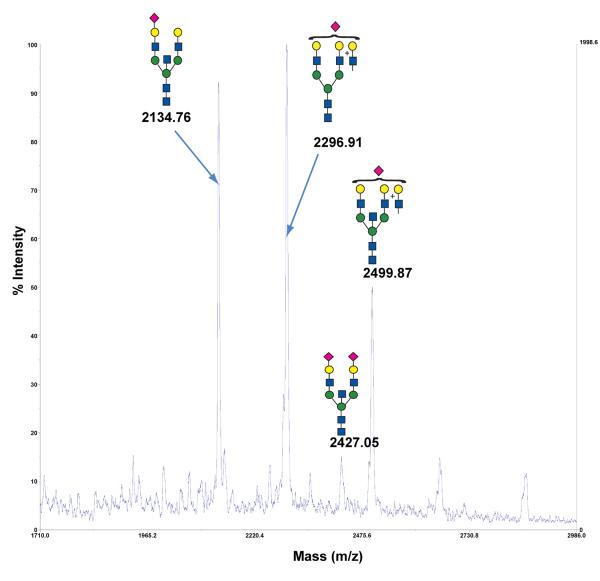
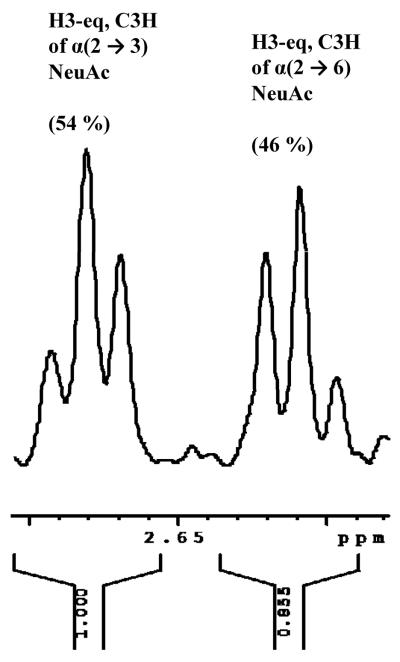
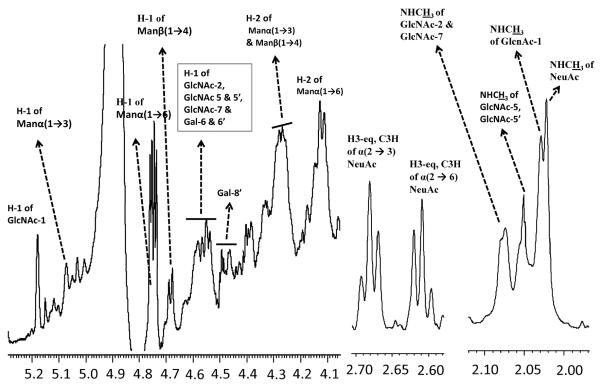
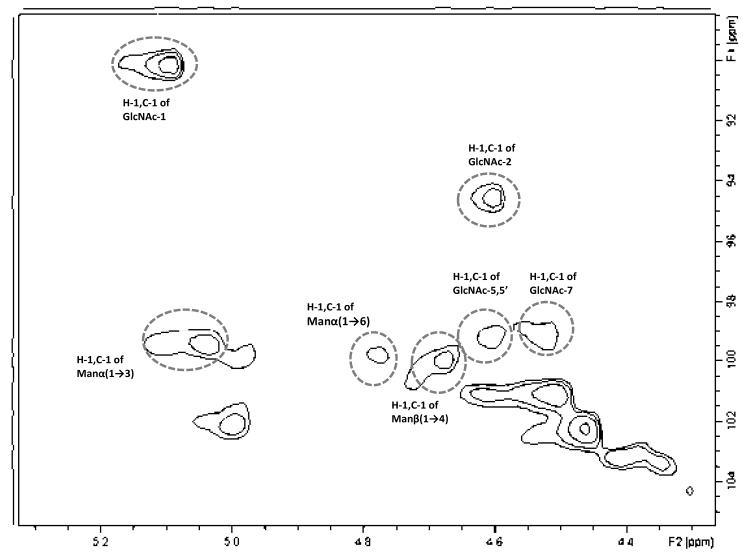
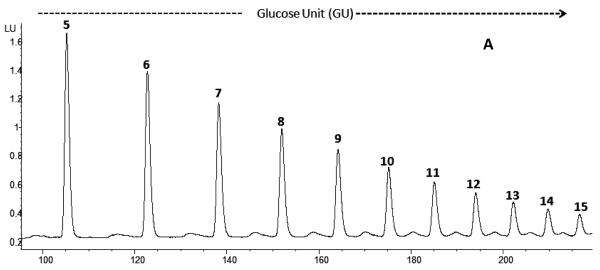
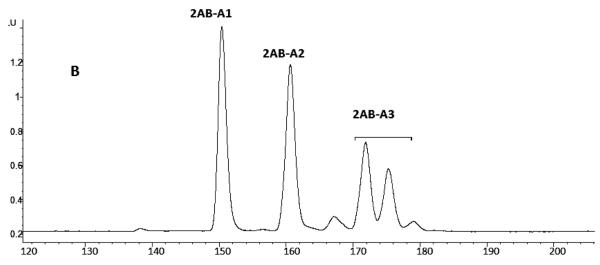
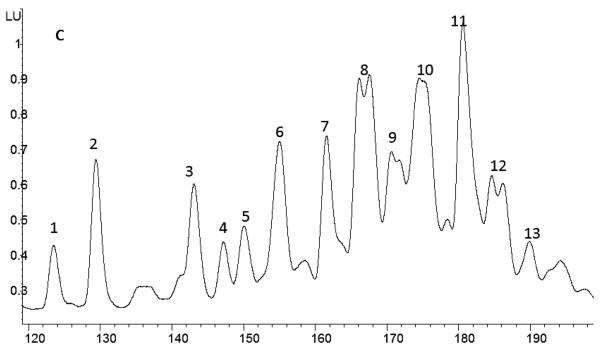
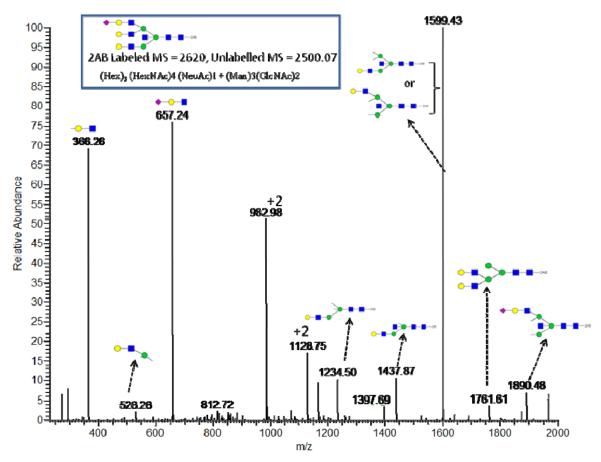
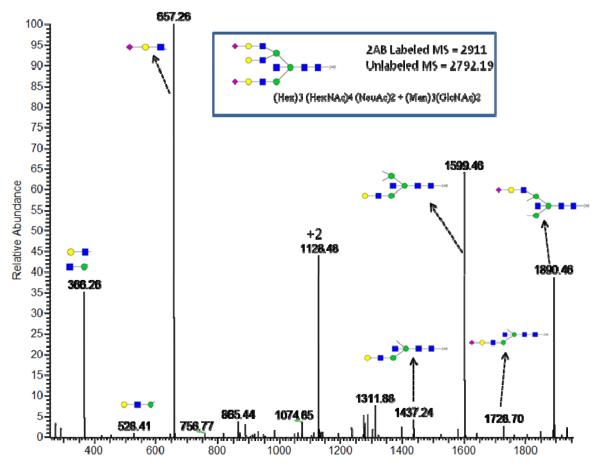
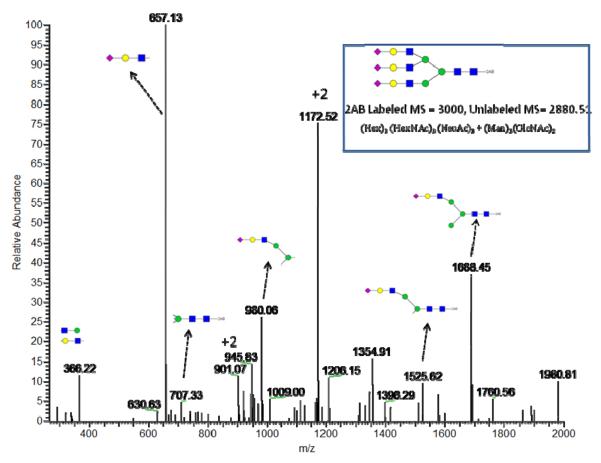
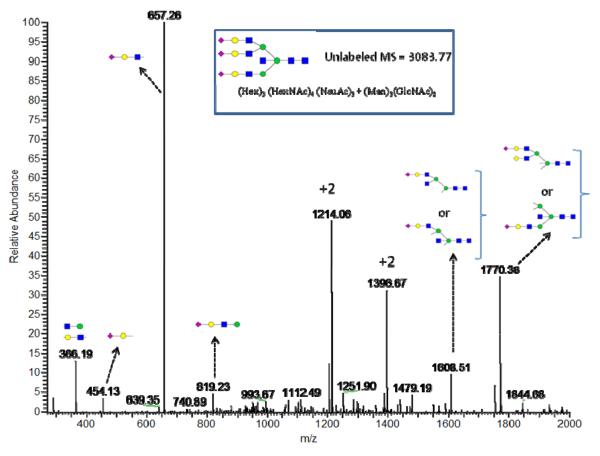
Agglutination of red blood cells (RBCs), including chicken RBCs (cRBCs), has been used extensively to estimate viral titer, to screen glycan-receptor binding preference, and to assess the protective response of vaccines. Although this assay enjoys widespread use, some virus strains do not agglutinate RBCs. To address these underlying issues and to increase the usefulness of cRBCs as tools for studying viruses, such as influenza, we analyzed the cell surface N-glycans of cRBCs. On the basis of the results obtained from complementary analytical strategies, including MS, 1D and 2D-NMR spectroscopy, exoglycosidase digestions, and HPLC profiling, we report the major glycan structures present on cRBCs. By comparing the glycan structures of cBRCs with those of representative human upper respiratory cells, we offer a possible explanation for the fact that certain influenza strains do not agglutinate cRBCs, using specific human-adapted influenza hemagglutinins as examples. Finally, recent understanding of the role of various glycan structures in high affinity binding to influenza hemagglutinins provides context to our findings. These results illustrate that the field of glycomics can provide important information with respect to the experimental systems used to characterize, detect and study viruses.


Figures

Fig. 1
Fig. 1. MALDI-TOF mass spectra of free, non-reduced N-glycans isolated from cRBCs
Peaks appeared in the mass range of 2000 to 3600 with the most prominent peaks at m/z 2589.1 and 2880.5. Each peak was calibrated as a non-sodiated species using external N-glycan standards as mass calibrants. Proposed glycan structures for each peak using MS annotation software are shown along with their observed m/z value. The number in the bracket for each glycan indicates the percentage of each corresponding glycan within the total glycan pool as estimated by semi-quantitative MALDI MS.
Fig. 2
Fig. 2. Qualitative and quantitative linkage analysis of N-glycans from cRBCs
(A) MALDI-MS spectra of sialidase S-treated, unlabeled, N-glycans that were released from cRBCs by PNGase F. (B) 1H-NMR spectra of sialic acid linkage in the free non reduced N-glycans isolated from cRBCs.
Fig. 2
Fig. 2. Qualitative and quantitative linkage analysis of N-glycans from cRBCs
(A) MALDI-MS spectra of sialidase S-treated, unlabeled, N-glycans that were released from cRBCs by PNGase F. (B) 1H-NMR spectra of sialic acid linkage in the free non reduced N-glycans isolated from cRBCs.
Fig. 3
Fig. 3. 1H-NMR (600 MHZ, D2O) spectra of N-glycans from cRBCs
Landmark chemical shifts are identified for each region of interest. The possible structural annotations of each monosaccharide fingerprint proton are labeled in the spectrum.
Fig. 4
Fig. 4. HSQC-spectra of N-glycans from cRBCs
The spectrum shows the cross peaks between the anomeric protons (5.25–4.30 ppm) and carbon (89–105 ppm) signals. The cross peaks confirm the presence of primarily bi- and triantennary structures. Notably, there is no cross peak detected at around 4.68–4.71 ppm, indicating the absence of lactosamine repeat units in the cRBC N-glycan pool.
Fig. 5
Fig. 5. HPLC profiling of 2AB-linked N-glycan isolated from cRBCs
Glycans are eluted using a normal phase column with a 50 mM ammonium formate/ acetonitrile gradient as eluant. Total run time is 290 minutes. (A) HPLC profiling of glucose homo-polymer for calibration of the column. (B) A mixture of three sialic acid containing N-glycans standards, chosen based on their polarity and molecular weight, are used as benchmarks. Three different species appeared in the retention time between 120–200 min. (C) 2-AB labeled N-glycan pool from cRBCs were analyzed within the calibrated and standardized column system. The acidic N-glycans from cRBCs eluted within the retention time window of 120–200 minutes. Glycan under each peak was determined from the MALDI-MS data of the isolated fraction of their corresponding peaks (Table S3).
Fig. 6
Fig. 6. LC-MS/MS data of selected MS peaks of N-glycans from cRBC
Shown are the MS/MS signals of 2-AB labeled structures: (A) 2620; (B) 2911; (C) 3000; and unlabeled structure: (D) 3083.8. Fragment assignments are shown for each structure.
Fig. 6
Fig. 6. LC-MS/MS data of selected MS peaks of N-glycans from cRBC
Shown are the MS/MS signals of 2-AB labeled structures: (A) 2620; (B) 2911; (C) 3000; and unlabeled structure: (D) 3083.8. Fragment assignments are shown for each structure.
Fig. 6
Fig. 6. LC-MS/MS data of selected MS peaks of N-glycans from cRBC
Shown are the MS/MS signals of 2-AB labeled structures: (A) 2620; (B) 2911; (C) 3000; and unlabeled structure: (D) 3083.8. Fragment assignments are shown for each structure.
Fig. 6
Fig. 6. LC-MS/MS data of selected MS peaks of N-glycans from cRBC
Shown are the MS/MS signals of 2-AB labeled structures: (A) 2620; (B) 2911; (C) 3000; and unlabeled structure: (D) 3083.8. Fragment assignments are shown for each structure.

References

    1. Hensley SE, Das SR, Bailey AL, Schmidt LM, Hickman HD, Jayaraman A, Viswanathan K, Raman R, Sasisekharan R, Bennink JR, Yewdell JW. Hemagglutinin receptor binding avidity drives influenza A virus antigenic drift. Science. 2009;326:734–6. - PMC - PubMed
    1. Maines TR, Jayaraman A, Belser JA, Wadford DA, Pappas C, Zeng H, Gustin KM, Pearce MB, Viswanathan K, Shriver ZH, Raman R, Cox NJ, Sasisekharan R, Katz JM, Tumpey TM. Transmission and pathogenesis of swine-origin 2009 A(H1N1) influenza viruses in ferrets and mice. Science. 2009;325:484–7. - PMC - PubMed
    1. Boon AC, French AM, Fleming DM, Zambon MC. Detection of influenza a subtypes in community-based surveillance. J Med Virol. 2001;65:163–70. - PubMed
    1. Amano Y, Cheng Q. Detection of influenza virus: traditional approaches and development of biosensors. Anal Bioanal Chem. 2005;381:156–64. - PubMed
    1. Zhang WD, Evans DH. Detection and identification of human influenza viruses by the polymerase chain reaction. J Virol Methods. 1991;33:165–89. - PubMed

Publication types

MeSH terms

Substances