. 2011 Mar 16:8:25.
doi: 10.1186/1742-2094-8-25.

Signal pathways in astrocytes activated by cross-talk between of astrocytes and mast cells through CD40-CD40L

Affiliations

Signal pathways in astrocytes activated by cross-talk between of astrocytes and mast cells through CD40-CD40L

Dae Yong Kim et al. J Neuroinflammation. .

Abstract

Background: Astrocytes, which play an active role in chronic inflammatory diseases like multiple sclerosis, exist close to mast cells with which they share perivascular localization. We previously demonstrated the possibility that astrocytes and mast cells interact in vitro and in vivo. This study aimed to investigate the signaling pathways and the role for astrocytes in the interaction of astrocytes and mast cells.

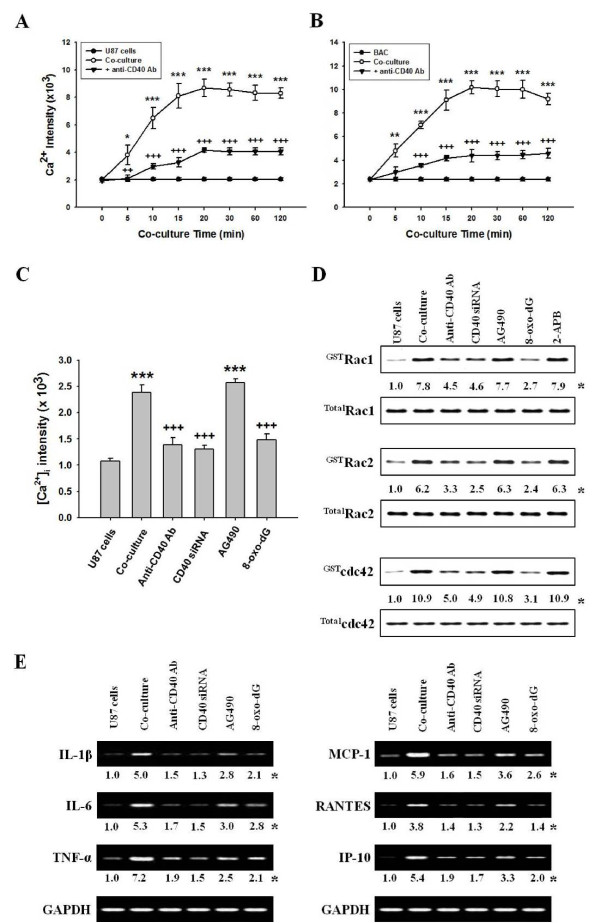
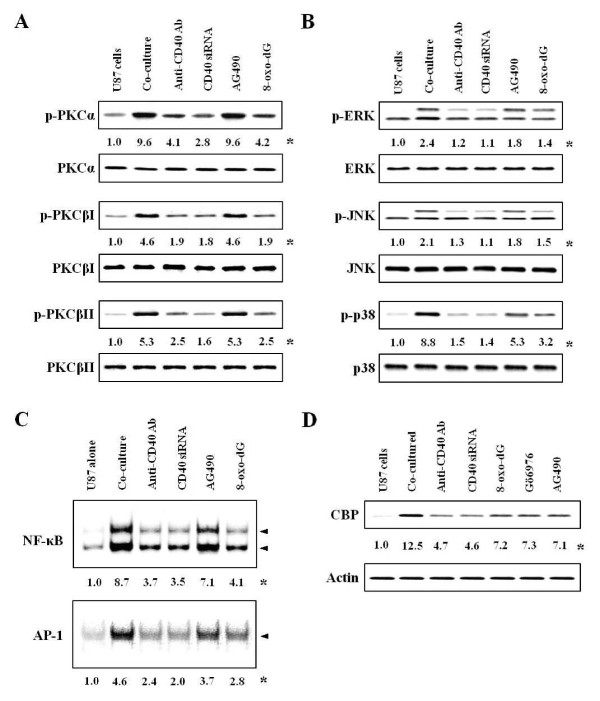
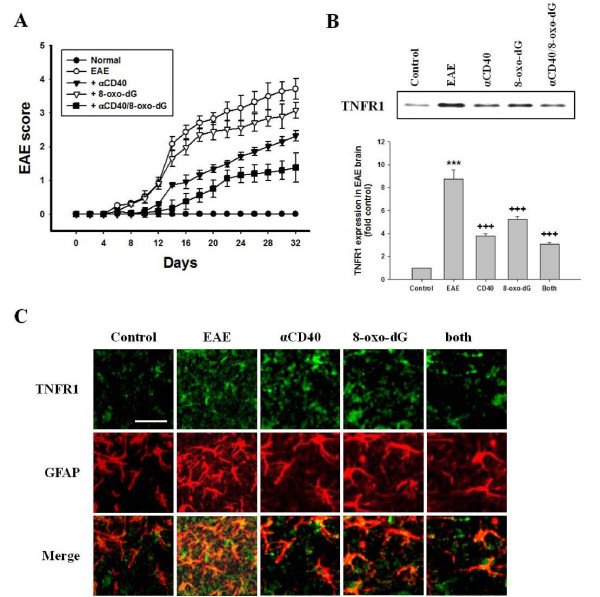
Methods: We co-cultured human U87 glioblastoma (U87) and human mast cell-1 (HMC-1) cell lines, and mouse cerebral cortices-derived astrocytes and mouse bone marrow-derived mast cells (BMMCs). Intracellular Ca2+ ([Ca2+]i) was measured by confocal microscopy; CD40 siRNA by Silencer Express Kit; small GTPases by GTP-pull down assay; PKCs, MAPKs, CD40, CD40L, Jak1/2, STAT1, TNF receptor 1 (TNFR1) by Western blot; NF-κB and AP-1 by EMSA; cytokines by RT-PCR. An experimental allergic encephalomyelitis (EAE) model was induced using myelin oligodendrocyte glycoprotein (MOG) peptide and pertussis toxin in mice. Co-localization of TNFR1 and astrocytes in EAE brain tissues was determined by immunohistochemistry.

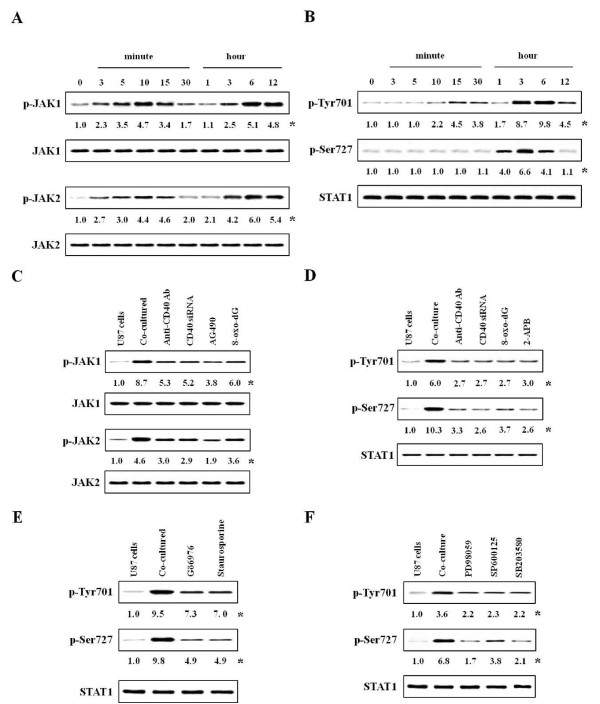
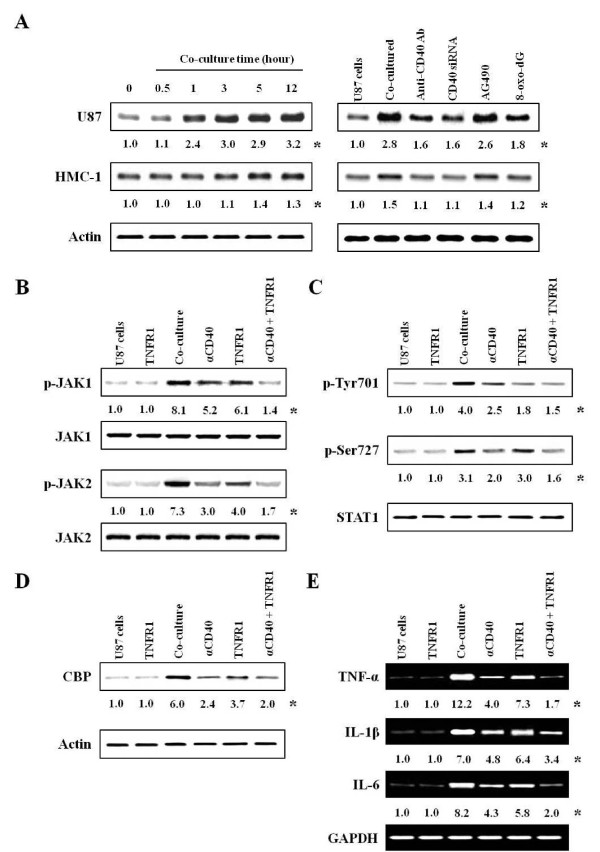
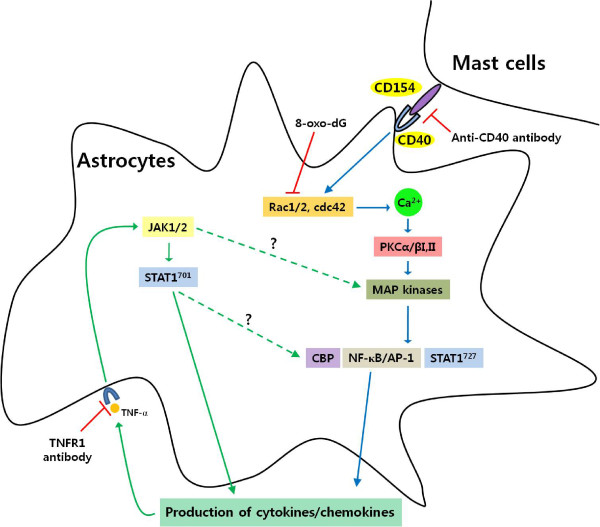
Results: Each astrocyte co-culture had increases in [Ca2+]i levels, release of cytokines and chemokines; activities of Rho-family GTPases, NF-κB/AP-1/STAT1727, and Jack1/2, STAT1701. These effects were inhibited by anti-CD40 antibody or CD40 siRNA, and signaling pathways for Jak1/2 were inhibited by anti-TNFR1 antibody. EAE score, expression of TNFR1, and co-localization of TNFR1 and astrocytes were enhanced in brain of the EAE model. Anti-CD40 antibody or 8-oxo-dG pretreatment reduced these effects in EAE model.

Conclusions: These data suggest that astrocytes activated by the CD40-CD40L interaction in co-culture induce inflammatory cytokine production via small GTPases, and the secreted cytokines re-activate astrocytes via Jak/STAT1701 pathways, and then release more cytokines that contribute to exacerbating the development of EAE. These findings imply that the pro-inflammatory mediators produced by cell-to-cell cross-talk via interaction of CD40-CD40L may be as a promising therapeutic target for neurodegenerative diseases like MS.


Figures

Figure 1
Figure 1
Activation of astrocytes co-cultured with mast cells. Astrocytes (3 × 10⁶ cells) and mast cells (1 × 10⁶ cells) were co-cultured in a 3:1 ratio. The anti-CD40 antibody (300 ng/ml), Jak inhibitor (10 μM AG490), 8-oxo-dG (300 μg/ml) or 2-APB (100 μM) was pretreated in astrocytes 1 h, 5, 10 and 10 min, respectively, before co-culture, and CD40 siRNA was transfected as described in "Methods". Fluro-3 AM (5.0 μM) was added to co-cultured-U87 cells or -primary astrocytes and incubated for 30 min. The [Ca2+]i level in U87 cells or in primary astrocytes was analyzed by confocal laser scanning microscopy. Rho-family GTPases or expressions of cytokine mRNA were determined in protein extracts and nuclear extracts by GST pull-down assay and RT-PCR, respectively. (A, B) Time course of [Ca2+]i level in co-cultured-U87 cells or -primary astrocytes, respectively, and in anti-CD40 antibody pretreatment. (C) The [Ca2+]i level after pretreatment with anti-CD40 antibody, CD40 siRNA or other inhibitors. (D) The activation of Rho-family GTPases by various inhibitors. (E) Expressions of cytokine mRNA caused by various inhibitors. U87 cells, U87 cell culture alone; BAC, primary astrocyte culture alone; Co-culture, U87 cells co-cultured with HMC-1 cells or BAC with BMMCs; Anti-CD40 Ab, anti-CD40 antibody pretreatment; CD40 siRNA, CD40 siRNA transfected-U87 cells co-cultured with HMC-1 cells; AG490, Jak inhibitor; 8-oxo-dG, 8-hydroxydeoxyguanosine. *, The numbers below bands are mean values and Figure 1A, B and C are mean ± SEM obtained from four independent experiments (n = 4) as the ratio bad density of each group versus that of total protein or GAPDH using densitometry analysis. *, P < 0.05; **, P < 0.01; ***, P < 0.001 versus U87 cell or primary astrocyte culture alone. ++, P < 0.01; +++, P < 0.001 versus co-cultured-U87 cells or -primary astrocytes.
Figure 2
Figure 2
Effects of inhibitors on activation of signal molecules in co-cultured-U87 cells. Experimental details in co-culture were indicated in Figure 1. The anti-CD40 antibody (300 ng/ml), Jak inhibitor (10 μM AG490) or 8-oxo-dG (300 μg/ml) was pretreated in astrocytes 1 h, 5 and 10 min, respectively, before co-culture, and CD40 siRNA was transfected, as described in "Methods". Activities of PKCs, MAP kinases and transcription factors were determined in protein extracts and nuclear extracts by Western blot and EMSA, respectively. (A, B) Activities of PKC isoforms and MAP kinases after inhibitor pretreatment. (C, D) Activities of NF-κB (upper panel) or AP-1 (lower panel) and expression of CBP after inhibitor pretreatment. *, Numbers below bands are mean values obtained from four independent experiments (n = 4) as the ratio of band density of each group versus that of total protein or actin using densitometry analysis.
Figure 3
Figure 3
Effects of inhibitors on activation of Jak 1/2 or STAT1 in co-cultured-U87 cells. Experimental details in co-culture were indicated in Figure 1. The anti-CD40 antibody (300 ng/ml), Jak inhibitor (10 μM AG490), 8-oxo-dG (300 μg/ml), PKC inhibitors (5 nM Gö6976 or staurosporine) or inhibitors of MAP kinase (50 μM PD98059 for ERK, 10 μM SP600125 for JNK, 10 μM SB203580 for p38) was pretreated in astrocytes 1 h, 5, 10 or 10 min, respectively, before co-culture, and CD40 siRNA was transfected, as described in "Methods". Activities of JAKs and STAT1 were determined in protein extracts by western blot using densitometry analysis. (A, B) Time courses for activities of Jak 1/2 and STAT1 after co-culture. (C, D) Activities of Jak 1/2 and STAT1 after inhibitors pretreatment. (E, F) Phosphorylation of STAT1 after pretreatment with PKC and MAP kinase inhibitors. *, Numbers below bands are values obtained from four independent experiments (n = 4) as the ratio of band density of each group versus that of total protein using densitometry analysis.
Figure 4
Figure 4
The effects of anti-TNFR1 antibody on the activation of co-cultured-U87 cells. Experimental details in co-culture were indicated in Figure 1. The anti-TNFR1 antibody (300 ng/ml) or anti-CD40 antibody (300 ng/ml) was pretreated in astrocytes 30 min and 1 h before co-culture. Expressions of TNFR1, activities of JAKs, STAT1 and CBP, and expressions of cytokine mRNA were determined in protein extracts and nuclear extracts by western blot and RT-PCR, respectively. (A) Expression of TNFR1 in co-cultured-U87 (left-upper panel) or -HMC-1 cells (left-lower panel), and expression of TNFR1 after inhibitor pretreatment (right panel). (B, C) Phosphorylations of Jak1/2 and STAT1 after inhibitor pretreatment. (D) Expression of CBP after inhibitor pretreatment. (E) Expressions of cytokine mRNA after inhibitor pretreatment. U87 cells, U87 cell culture alone; TNFR1, anti-TNFR1 antibody alone pretreatment in U87 cells; Co-culture, U87 cells co-cultured with HMC-1 cells; αCD40, anti-CD40 antibody pretreatment; αCD40 + TNFR1, anti-CD40 antibody and anti-TNFR1 antibody pretreatment before co-culture. *, Numbers below bands are values obtained from four independent experiments (n = 4) as the ratio of band density of each group versus those of total protein, actin or GAPDH using densitometry analysis.
Figure 5
Figure 5
Clinical score and co-localization of TNFR1 in EAE-induced mouse brain. EAE mouse model was immunized with MOG and CFA, and scored daily as described in "Methods". Mice received anti-CD40 antibody (1 mg/kg), 8-oxo-dG (60 mg/kg) or a combination of anti-CD 40 antibody and 8-oxo-dG, respectively, with i.p. injection for 5 days after MOG injection. After animal sacrifice at day 32 (EAE score, 3.8 ± 0.21), brains were removed and preserved in 10% neutral buffered formalin. Expressions of TNFR1 were determined in protein extracts by western blot, and co-localization was determined by double staining for TNFR1 (green) and GFAP (red). (A) EAE score after pretreatment with inhibitors Data are mean ± SEM (n = 8). (B) Expression of TNFR1 (n = 4). Histogram for densitometry analysis was indicated by mean ± SEM (n = 4) obtained from four independent experiments. (C) Co-localization of TNFR1 and astrocytes after pretreatment with inhibitors (n = 4). The image depicted one of representative results after four independent experiments were determined. TNFR1, TNF-α receptor 1; αCD40, anti-CD40 antibody; 8-oxo-dG, 8-hydroxydexoyquanosine; both, a combination of anti-CD40 antibody and 8-oxo-dG. Bar in control group indicates 100 μm.
Figure 6
Figure 6
Schematic diagram showing signaling pathways in co-cultured-astrocytes. The data suggest that activation of astrocytes caused by co-culturing with mast cells through CD40-CD40 interaction mainly induces production of cytokines and chemokines via Rho-family GTPases/Ca2+-dependent PKC isoforms, MAP kinases, NF-κB and STAT1727. These cytokines subsequently re-activate astrocytes, and enhance the production of a variety of cytokines via Jak/STAT1701 or STAT1727/CBP pathways. TNFR1, TNF-α receptor 1; CD154, CD40 ligand. Broken lines show parts of the pathways requiring further study.

Similar articles

Cited by

References

    1. Koehler RC, Gebremedhin D, Harder DR. Role of astrocytes in cerebrovascular regulation. J Appl Physiol. 2006;100:307–317. doi: 10.1152/japplphysiol.00938.2005. - DOI - PMC - PubMed
    1. Nair A, Frederick TJ, Miller SD. Astrocytes in multiple sclerosis: A product of their environment. Cell Mo Life Sci. 2008;65:2702–2720. doi: 10.1007/s00018-008-8059-5. - DOI - PMC - PubMed
    1. Frohman EM, Racke MK, Raine CS. Multiple sclerosis-the plaque and its pathogenesis. N Engl J Med. 2006;354:942–955. doi: 10.1056/NEJMra052130. - DOI - PubMed
    1. Weiner HL. The challenge of multiple sclerosis: how do we cure a chronic heterogeneous disease? Ann Neurol. 2009;65:239–248. doi: 10.1002/ana.21640. - DOI - PubMed
    1. Sweeney CM, Tubridy N, Mills KH. T cells in multiple sclerosis and experimental autoimmune encephalomyelitis. Clin Exp Immunol. 2010;162:1–11. doi: 10.1111/j.1365-2249.2010.04143.x. - DOI - PMC - PubMed

Publication types

MeSH terms