Sequential analysis of global gene expression profiles in immature and in vitro matured bovine oocytes: potential molecular markers of oocyte maturation
- PMID: 21410957
- PMCID: PMC3068982
- DOI: 10.1186/1471-2164-12-151
Sequential analysis of global gene expression profiles in immature and in vitro matured bovine oocytes: potential molecular markers of oocyte maturation
Abstract
Background: Without intensive selection, the majority of bovine oocytes submitted to in vitro embryo production (IVP) fail to develop to the blastocyst stage. This is attributed partly to their maturation status and competences. Using the Affymetrix GeneChip Bovine Genome Array, global mRNA expression analysis of immature (GV) and in vitro matured (IVM) bovine oocytes was carried out to characterize the transcriptome of bovine oocytes and then use a variety of approaches to determine whether the observed transcriptional changes during IVM was real or an artifact of the techniques used during analysis.
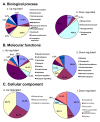
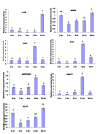
Results: 8489 transcripts were detected across the two oocyte groups, of which ~25.0% (2117 transcripts) were differentially expressed (p < 0.001); corresponding to 589 over-expressed and 1528 under-expressed transcripts in the IVM oocytes compared to their immature counterparts. Over expression of transcripts by IVM oocytes is particularly interesting, therefore, a variety of approaches were employed to determine whether the observed transcriptional changes during IVM were real or an artifact of the techniques used during analysis, including the analysis of transcript abundance in oocytes in vitro matured in the presence of α-amanitin. Subsets of the differentially expressed genes were also validated by quantitative real-time PCR (qPCR) and the gene expression data was classified according to gene ontology and pathway enrichment. Numerous cell cycle linked (CDC2, CDK5, CDK8, HSPA2, MAPK14, TXNL4B), molecular transport (STX5, STX17, SEC22A, SEC22B), and differentiation (NACA) related genes were found to be among the several over-expressed transcripts in GV oocytes compared to the matured counterparts, while ANXA1, PLAU, STC1and LUM were among the over-expressed genes after oocyte maturation.
Conclusion: Using sequential experiments, we have shown and confirmed transcriptional changes during oocyte maturation. This dataset provides a unique reference resource for studies concerned with the molecular mechanisms controlling oocyte meiotic maturation in cattle, addresses the existing conflicting issue of transcription during meiotic maturation and contributes to the global goal of improving assisted reproductive technology.
Figures


Similar articles
-
Differences in cumulus cell gene expression indicate the benefit of a pre-maturation step to improve in-vitro bovine embryo production.Mol Hum Reprod. 2016 Dec;22(12):882-897. doi: 10.1093/molehr/gaw055. Epub 2016 Aug 24. Mol Hum Reprod. 2016. PMID: 27559149
-
Global gene expression analysis during bovine oocyte in vitro maturation.Theriogenology. 2007 Sep 1;68 Suppl 1:S91-7. doi: 10.1016/j.theriogenology.2007.04.018. Epub 2007 May 18. Theriogenology. 2007. PMID: 17512044 Review.
-
"Bone Development" Is an Ontology Group Upregulated in Porcine Oocytes Before In Vitro Maturation: A Microarray Approach.DNA Cell Biol. 2017 Aug;36(8):638-646. doi: 10.1089/dna.2017.3677. Epub 2017 Jun 2. DNA Cell Biol. 2017. PMID: 28574720
-
Gene expression in bovine oocytes and cumulus cells after meiotic inhibition with the cyclin-dependent kinase inhibitor butyrolactone I.Reprod Domest Anim. 2012 Aug;47(4):615-24. doi: 10.1111/j.1439-0531.2011.01932.x. Epub 2011 Oct 28. Reprod Domest Anim. 2012. PMID: 22034924
-
Bovine oocyte meiotic inhibition before in vitro maturation and its value to in vitro embryo production: does it improve developmental competence?Reprod Domest Anim. 2012 Aug;47(4):687-93. doi: 10.1111/j.1439-0531.2011.01924.x. Epub 2011 Oct 12. Reprod Domest Anim. 2012. PMID: 21988654 Review.
Cited by
-
Expression of TGFβ superfamily components and other markers of oocyte quality in oocytes selected by brilliant cresyl blue staining: relevance to early embryonic development.Mol Reprod Dev. 2015 Mar;82(3):251-64. doi: 10.1002/mrd.22468. Epub 2015 Feb 20. Mol Reprod Dev. 2015. PMID: 25704641 Free PMC article.
-
Single-Cell RNA-Seq Revealed the Gene Expression Pattern during the In Vitro Maturation of Donkey Oocytes.Genes (Basel). 2021 Oct 19;12(10):1640. doi: 10.3390/genes12101640. Genes (Basel). 2021. PMID: 34681034 Free PMC article.
-
Effects of Different Maturation Systems on Bovine Oocyte Quality, Plasma Membrane Phospholipid Composition and Resistance to Vitrification and Warming.PLoS One. 2015 Jun 24;10(6):e0130164. doi: 10.1371/journal.pone.0130164. eCollection 2015. PLoS One. 2015. PMID: 26107169 Free PMC article.
-
Transcriptome and proteome analysis of pregnancy and postpartum anoestrus ovaries in yak.J Vet Sci. 2022 Jan;23(1):e3. doi: 10.4142/jvs.21195. J Vet Sci. 2022. PMID: 35088950 Free PMC article.
-
Single-cell multiomic analysis reveals methylome and transcriptome deviations following oocyte maturation in vitro.Reproduction. 2025 Jul 10;170(2):e250011. doi: 10.1530/REP-25-0011. Print 2025 Aug 1. Reproduction. 2025. PMID: 40569608 Free PMC article.
References
Publication types
MeSH terms
Substances
LinkOut - more resources
Full Text Sources
Molecular Biology Databases
Research Materials
Miscellaneous

