

Using an online survey of healthcare-seeking behaviour to estimate the magnitude and severity of the 2009 H1N1v influenza epidemic in England
- PMID: 21410965
- PMCID: PMC3073914
- DOI: 10.1186/1471-2334-11-68
Using an online survey of healthcare-seeking behaviour to estimate the magnitude and severity of the 2009 H1N1v influenza epidemic in England
Abstract
Background: During the 2009 H1N1v influenza epidemic, the total number of symptomatic cases was estimated by combining influenza-like illness (ILI) consultations, virological surveillance and assumptions about healthcare-seeking behaviour. Changes in healthcare-seeking behaviour due to changing scientific information, media coverage and public anxiety, were not included in case estimates. The purpose of the study was to improve estimates of the number of symptomatic H1N1v cases and the case fatality rate (CFR) in England by quantifying healthcare-seeking behaviour using an internet-based survey carried out during the course of the 2009 H1N1v influenza epidemic.
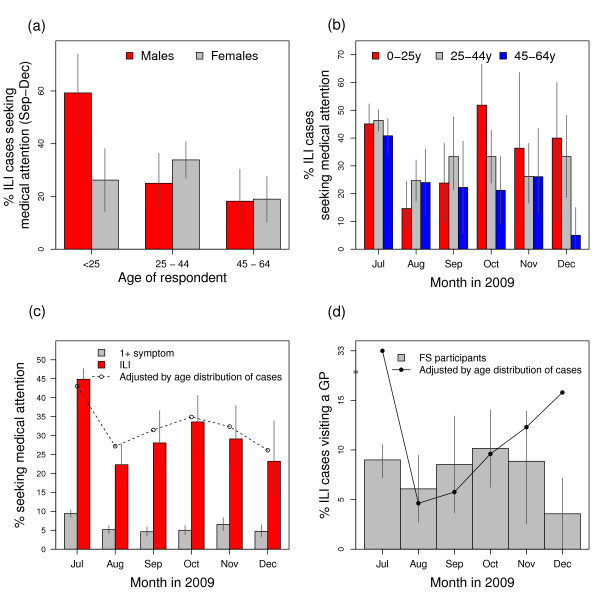
Methods: We used an online survey that ran continuously from July 2009 to March 2010 to estimate the proportion of ILI cases that sought healthcare during the 2009 H1N1v influenza epidemic. We used dynamic age- and gender-dependent measures of healthcare-seeking behaviour to re-interpret consultation numbers and estimate the true number of cases of symptomatic ILI in 2009 and the case fatality rate (CFR).
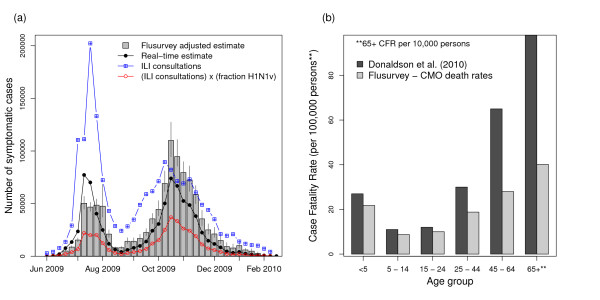
Results: There were significant differences between age groups in healthcare usage. From the start to the end of the epidemic, the percentage of individuals with influenza-like symptoms who sought medical attention decreased from 43% to 32% (p < 0.0001). Adjusting official numbers accordingly, we estimate that there were 1.1 million symptomatic cases in England, over 320,000 (40%) more cases than previously estimated and that the autumn epidemic wave was 45% bigger than previously thought. Combining symptomatic case numbers with reported deaths leads to a reduced overall CFR estimate of 17 deaths per 100,000 cases, with the largest reduction in adults.
Conclusions: Active surveillance of healthcare-seeking behaviour, which can be achieved using novel data collection methods, is vital for providing accurate real-time estimates of epidemic size and disease severity. The differences in healthcare-seeking between different population groups and changes over time have significant implications for estimates of total case numbers and the case fatality rate.
Figures
References
-
- "World Health Organization". Pandemic influenza preparedness and response: a WHO guidance document. 2009. - PubMed
-
- Health Protection Agency. Weekly epidemiological updates. http://www.hpa.org.uk/Topics/InfectiousDiseases/InfectionsAZ/SeasonalInf...
-
- Royal College of General Practitioners. Weekly Returns Service Annual Report 2009. 2009.
-
- Rubin GJ, Potts HWW, Michie S. The impact of communications about swine flu (influenza A H1N1v) on public responses to the outbreak: results from 36 national telephone surveys in the UK. Health Technol Assess. 2010;14:183–266. - PubMed
Publication types
MeSH terms
LinkOut - more resources
Full Text Sources
Medical
Miscellaneous
