

Pulmonary stretch receptor spike time precision increases with lung inflation amplitude and airway smooth muscle tension
- PMID: 21411567
- PMCID: PMC3094183
- DOI: 10.1152/jn.00514.2010
Pulmonary stretch receptor spike time precision increases with lung inflation amplitude and airway smooth muscle tension
Abstract
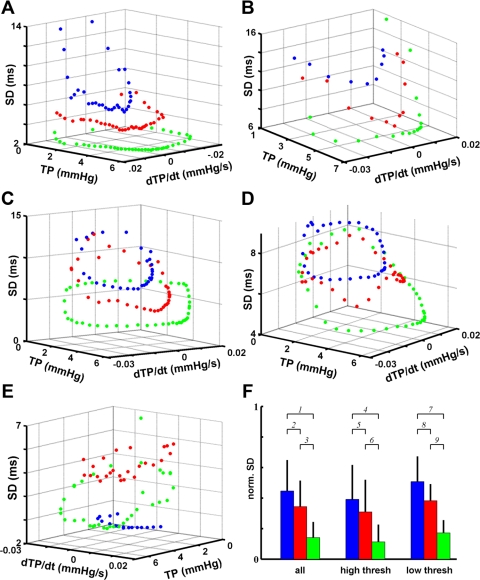
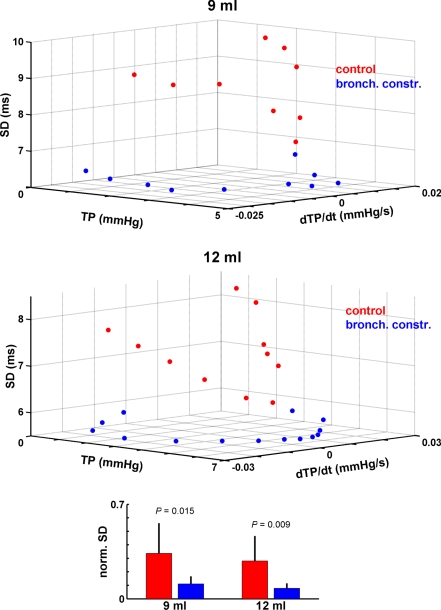
Slowly adapting pulmonary stretch receptors (SARs) respond to different lung inflation volumes with distinct spike counts and patterns, conveying information regarding the rate and depth of breathing to the cardiovascular and respiratory control systems. Previous studies demonstrated that SARs respond to repetitions of the same lung inflation faithfully, suggesting the possibility of modeling an SAR's discrete response pattern to a stimulus using a statistically based method. Urethane-anesthetized rabbit SAR spike trains were recorded in response to repeated 9-, 12-, and 15-ml lung inflations, and used to construct model spike trains using K-means clustering. Analysis of the statistics of the responses to different lung inflation volumes revealed that SARs fire with more temporal precision in response to larger lung inflations, because the standard deviations of real spikes clustered around the modeled spike times of responses to 15-ml stimuli were smaller than those produced by 12 or 9 ml, even at the same absolute firing frequencies. This implied that the mechanical coupling of SAR endings with pulmonary tissue is critical in determining spike time reliability. To test this, we collected SAR responses during bronchial constriction, compared them with those produced by the same SARs under normal airway resistance, and found that their firing reliability improved during bronchial constriction. These results suggest that airway distension and mechanical coupling of the receptor endings with the airway wall (partially determined by smooth muscle tone) are important determinants of SAR spike time reliability.
Figures


Similar articles
-
Slowly adapting pulmonary stretch receptor spike patterns carry lung distension information.Neurosci Lett. 2010 Oct 22;484(1):86-91. doi: 10.1016/j.neulet.2010.08.026. Epub 2010 Aug 13. Neurosci Lett. 2010. PMID: 20709146
-
Effects of vagal stimulation on slowly adapting pulmonary stretch receptors and lung mechanics in anesthetized rabbits.Lung. 1996;174(5):333-44. doi: 10.1007/BF00176192. Lung. 1996. PMID: 8843059
-
Airway mechanoreceptor deactivation.J Appl Physiol (1985). 2007 Aug;103(2):600-7. doi: 10.1152/japplphysiol.01286.2006. Epub 2007 May 24. J Appl Physiol (1985). 2007. PMID: 17525293
-
Functional morphology and physiology of slowly adapting pulmonary stretch receptors.Anat Rec A Discov Mol Cell Evol Biol. 2003 Jan;270(1):11-6. doi: 10.1002/ar.a.10004. Anat Rec A Discov Mol Cell Evol Biol. 2003. PMID: 12494485 Review.
-
An overview of the anatomy and physiology of slowly adapting pulmonary stretch receptors.Respir Physiol. 2001 Mar;125(1-2):17-31. doi: 10.1016/s0034-5687(00)00202-4. Respir Physiol. 2001. PMID: 11240150 Review.
References
-
- Abeles M, Gerstein GL. Detecting spatiotemporal firing patterns among simultaneously recorded single neurons. J Neurophysiol 60: 909–924, 1988 - PubMed
-
- Averill DB, Cameron WE, Berger AJ. Monosynaptic excitation of dorsal medullary respiratory neurons by slowly adapting pulmonary stretch receptors. J Neurophysiol 52: 771–785, 1984 - PubMed
-
- Ball GH, Hall DJ. A clustering technique for summarizing multivariate data. Behav Sci 12: 153–155, 1967 - PubMed
-
- Berger D, Pribram K, Wild H, Bridges C. An analysis of neural spike-train distributions: determinants of the response of visual cortex neurons to changes in orientation and spatial frequency. Exp Brain Res 80: 129–134, 1990 - PubMed
-
- Berger AJ, Dick TE. Connectivity of slowly adapting pulmonary stretch receptors with dorsal medullary respiratory neurons. J Neurophysiol 58: 1259–1274, 1987 - PubMed
Publication types
MeSH terms
Grants and funding
LinkOut - more resources
Full Text Sources
Miscellaneous