Comparative Study
. 2011 Apr;59(4):391-407.
doi: 10.1369/0022155411400867.

Inconsistent immunohistochemical expression patterns of four different CD133 antibody clones in glioblastoma

Affiliations
Comparative Study

Inconsistent immunohistochemical expression patterns of four different CD133 antibody clones in glioblastoma

Simon K Hermansen et al. J Histochem Cytochem. 2011 Apr.

Abstract

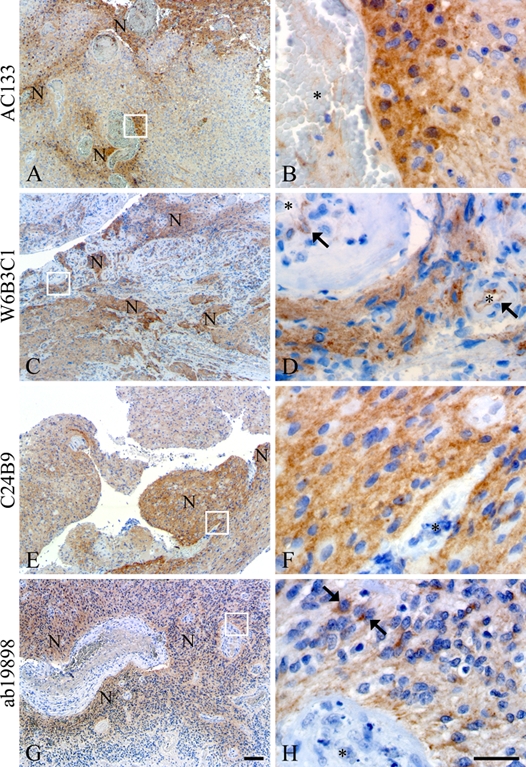
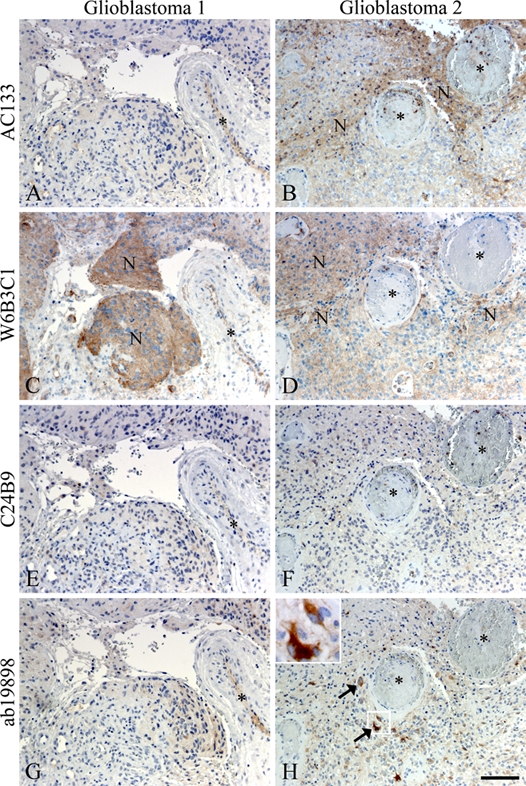
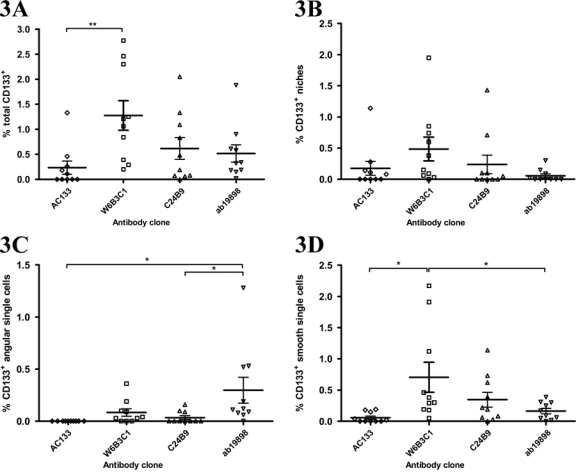
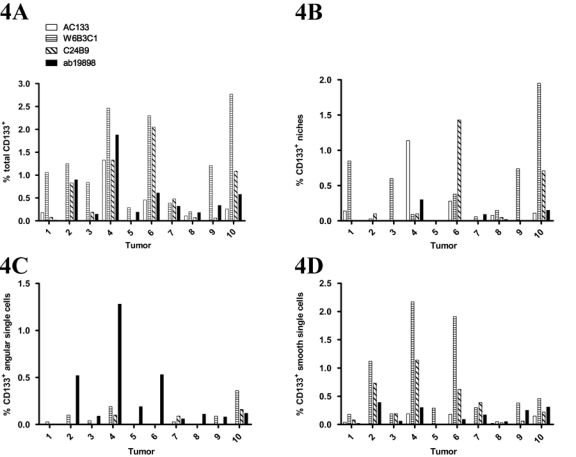
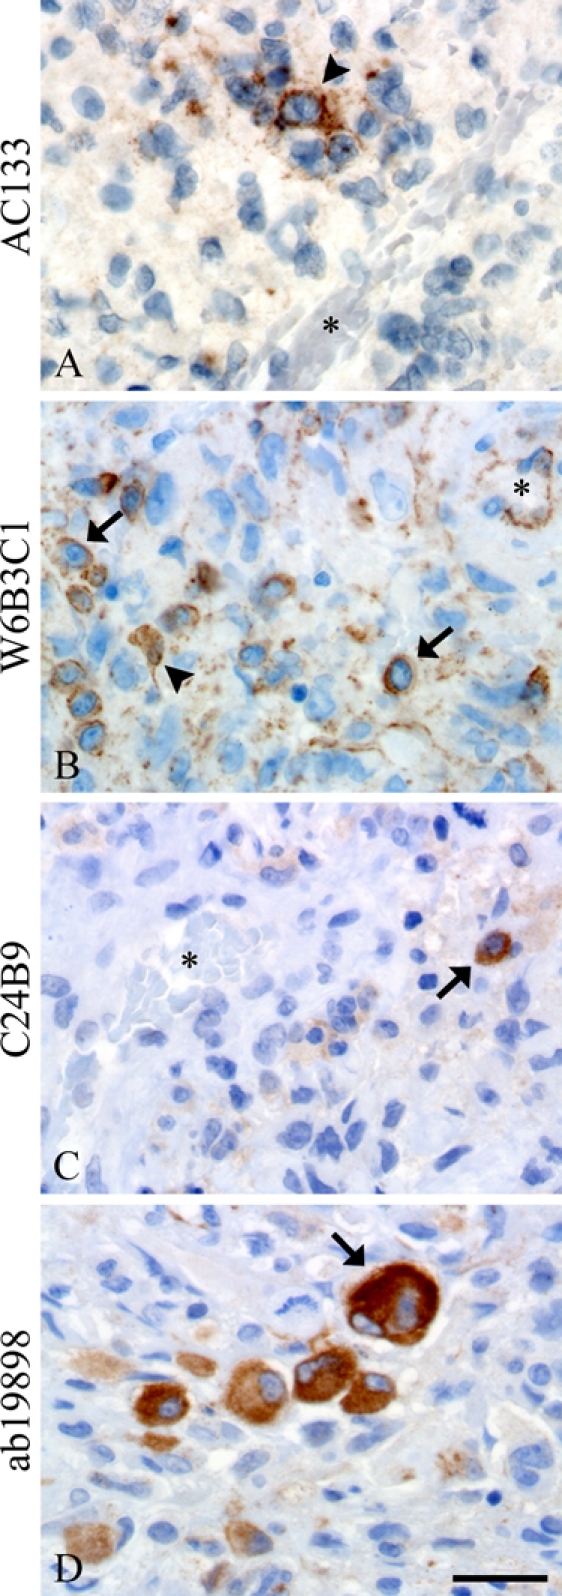
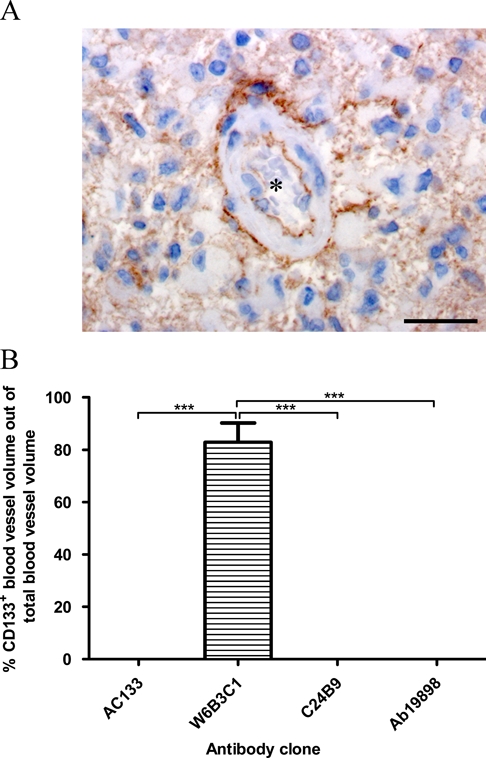
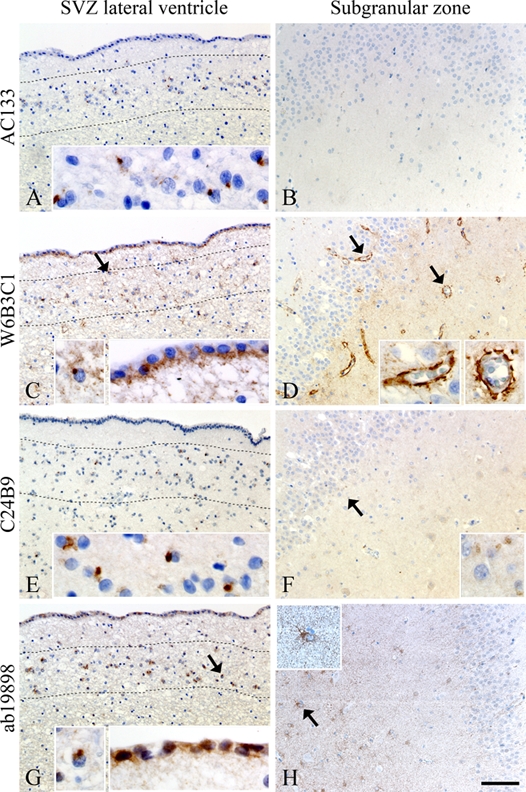
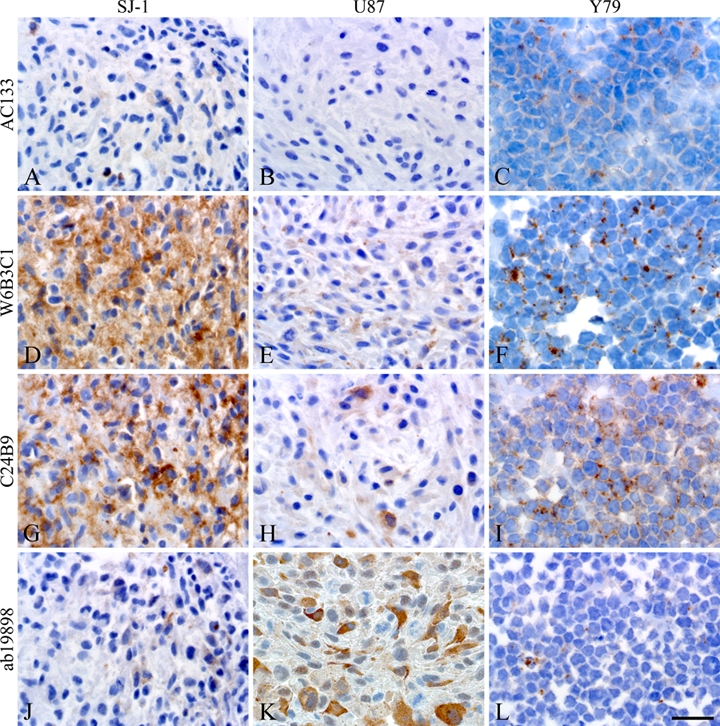
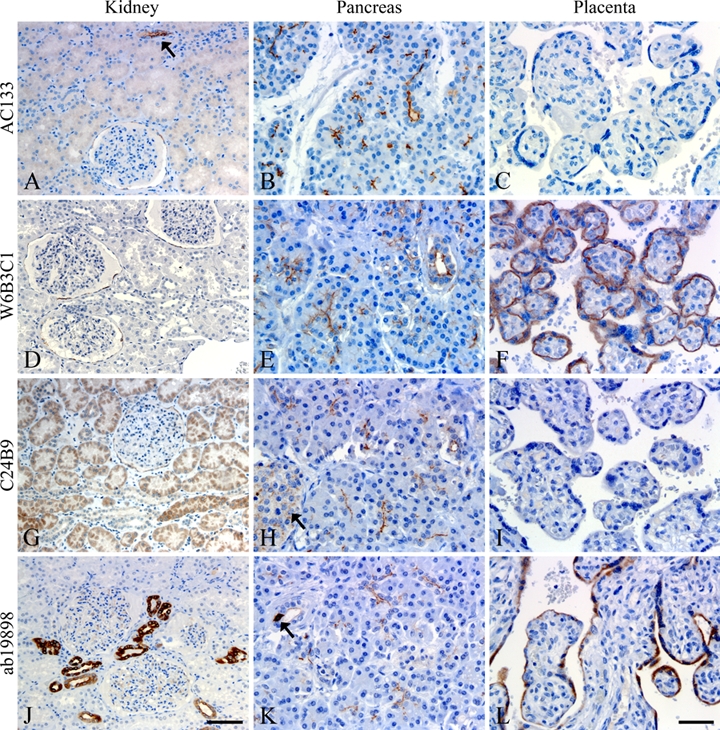
The putative tumor stem cell marker CD133 is the marker of choice for identifying brain tumor stem cells in gliomas, but the use of different CD133 antibody clones possibly recognizing different CD133 splice variants with epitopes of different glycosylation status confuses the field. The aim was to investigate if current inconsistent CD133 observations could be a result of using different CD133 antibodies for immunohistochemical identification of CD133. Ten glioblastomas were immunohistochemically stained with four different CD133 antibody clones (AC133, W6B3C1, C24B9, and ab19898) and analyzed by quantitative stereology. Moreover, the CD133 staining pattern of each antibody clone was investigated in kidney, pancreas, and placenta tissue as well as in glioblastoma and retinoblastoma cultures and cell lines. All antibody clones revealed CD133+ niches and single cells in glioblastomas, but when using different clones, their distribution rarely corresponded. Morphology of identified single cells varied, and staining of various tissues, cultures, and cells lines was also inconsistent among the clones. In conclusion, the authors report inconsistent CD133 detection when using different primary CD133 antibody clones. Thus, direct comparison of studies using different antibody clones and conclusions based on CD133 immunohistochemistry should be performed with caution.


Conflict of interest statement

The author(s) declared no potential conflicts of interest with respect to the authorship and/or publication of this article.

Figures

Figure 1.
Figure 1.
All clones AC133 (A, B), W6B3C1 (C, D), C24B9 (E, F), and ab19898 (G, H) identified niches of perivascular tumor cells in the glioblastomas. W6B3C1 also showed staining of the basal endothelial membrane of most blood vessels (arrows, D). Clone ab19898 intensely stained dispersed cells within the niches (arrows, H). Vessel lumen is indicated by an asterisk (B, D, F, H), and N denotes niches. Scale bars: 50 µm (A, C, E, G); 30 µm (B, D, F, H).
Figure 2.
Figure 2.
Immunohistochemical staining of adjacent glioblastoma sections with the CD133 antibody clones AC133 (A, B), W6B3C1 (C, D), C24B9 (E, F), and ab19898 (G, H). Differences in intensity and appearance of CD133+ niches were evident. In glioblastoma 1, W6B3C1 identified a clearly demarcated perivascular niche (C), whereas AC133, C24B9, and ab19898 showed little or no reaction in the same area (A, E, G). In glioblastoma 2, both AC133 and W6B3C1 identified niches of CD133+ cells (B, D), whereas C24B9 and ab19898 did not (F, H). Ab19898, however, did identify dispersed single cells with intense cytoplasmatic staining in the same area (arrows and inserts, H). N denotes niches, and vessel lumen is indicated by an asterisk. Scale bar: 100 µm.
Figure 3.
Figure 3.
Scatter plots showing the tumor volume fractions of total CD133 positivity (A), CD133+ niches (B), CD133+ angular single cells (C), and CD133+ smooth single cells (D) obtained by staining adjacent sections with CD133 antibody clones AC133, W6B3C1, C24B9, and ab19898 in 10 glioblastomas. Total CD133+ volume fraction (A) includes volume fractions of CD133+ niches (B), angular single cells (C), and smooth single cells (D). Significantly higher total CD133+ volume fractions were identified using W6B3C1 than when using AC133 (**). The volume fraction of CD133+ angular single cells identified using ab19898 was significantly higher than the volume fraction identified using AC133 and C24B9 (C, *). Tumor volume fraction of CD133+ smooth single cells was significantly higher when identified by W6B3C1 than when identified with AC133 and ab19898 (D, *). Horizontal lines denote mean and standard error of mean. *p<0.05. **p<0.01.
Figure 4.
Figure 4.
Graphs showing tumor volume fraction variation of total CD133 positivity (A), CD133+ niches (B), CD133+ angular single cells (C), and CD133+ smooth single cells (D) obtained by staining adjacent sections from 10 glioblastomas with CD133 antibody clones AC133, W6B3C1, C24B9, and ab19898.
Figure 5.
Figure 5.
All clones identified CD133+ dispersed single cells in glioblastomas, but their morphology ranged from cells having ramifications and protrusions (arrowheads, A, B) to small (arrows, B, C) or bigger multinucleated cells (arrow, D). W6B3C1 had a tendency to stain tumor cell plasma membranes more than the cytoplasm (arrows, B), whereas AC133, C24B9, and ab19898 mostly stained the cytoplasm (arrowhead, A; arrows, C, D). Asterisks denote blood vessel lumen. Scale bar: 30 µm.
Figure 6.
Figure 6.
W6B3C1 displayed a railway-like staining pattern of some blood vessels (A), whereas no stained blood vessels were identified using AC133, ab19898, or C24B9. The percentage of CD133+ blood vessel volume out of total blood vessel volume obtained by each antibody clone was estimated (B). Scalebar: 30 µm, ***p<0.001.
Figure 7.
Figure 7.
Comparative staining on sections of stem cell regions in healthy adult brain tissue using antibody clones AC133 (A, B), W6B3C1 (C, D), C24B9 (E, F), and ab19898 (G, H). A subependymal cell population with juxtanuclear staining was identified in the subventricular zone (SVZ) of the lateral ventricle by all antibody clones. The juxtanuclear staining was constricted to one pole of the cells, and the majority of positive cells were clustered in subependymal bands delineated by dotted lines (arrows and inserts, A, C, E, G). W6B3C1 and ab19898 also stained ependymal cells in SVZ (C, G), whereas no ependymal positivity was seen using AC133 and C24B9 (A, E). C24B9 and ab19898 stained the cytoplasm of few cells in the hippocampal subgranular zone (arrows and inserts, F, H), whereas AC133 was blank negative (B). Clone W6B3C1 was the only antibody to identify brain blood vessels (arrows and inserts, D). Scale bar: 100 µm.
Figure 8.
Figure 8.
Comparative staining on paraffin sections of glioblastoma short-term culture SJ-1 spheroids, glioblastoma cell line U87 spheroids, and retinoblastoma cell line Y79 clusters. W6B3C1 and C24B9 identified intense expression of CD133 in SJ-1 (D, G), whereas AC133 and ab19898 did not (A, J). Little immunoreactivity was seen in U87 using AC133, W6B3C1, and C24B9 (B, E, H), but ab19898 displayed intense cytoplasmatic staining of numerous cells (K). All clones stained cells from the Y79 cell line, and the staining was mostly dotted and membranous and/or cytoplasmatic with the appearance of dispersed juxtanuclear staining as well (C, F, I, L). Images of SJ-1 and U87 were from adjacent sections of the same spheroid. Scale bar: 30 µm.
Figure 9.
Figure 9.
Comparative staining of kidney (A, D, G, J), pancreas (B, E, H, K), and placenta (C, F, I, L) tissues. A varying degree of CD133 positivity was observed in kidney glomeruli, tubuli, and collecting ducts between the clones (A, D, G, J). Arrow in A shows a stained collecting duct. Positive reaction in pancreas was mainly constricted to the apical/endoluminal surface of glandular epithelial and ductal cells (B, E, H, K), but some diffuse staining of islets of Langerhans (arrow, H) and cytoplasmatic staining of pancreatic ductal cells could be observed (arrow, K). Placental tissue was negative using AC133 and C24B9 (C, I) and positive in trophoblasts/syncytiotrophoblasts of chorionic villi using W6B3C1 and ab19898 (F, L). Scale bars: 100 µm (A, D, G, J); 50 µm (B, C, E, F, H, I, K, L).

References

    1. Al-Hajj M, Wicha MS, Ito-Hernandez A, Morrison SJ, Clarke MF. 2003. Prospective identification of tumorigenic breast cancer cells. Proc Natl Acad Sci U S A. 100:3983–3988 - PMC - PubMed
    1. Beier D, Hau P, Proescholdt M, Lohmeier A, Wischhusen J, Oefner PJ, Aigner L, Brawanski A, Bogdahn U, Beier CP. 2007. CD133(+) and CD133(−) glioblastoma-derived cancer stem cells show differential growth characteristics and molecular profiles. Cancer Res. 67:4010–4015 - PubMed
    1. Beier D, Wischhusen J, Dietmaier W, Hau P, Proescholdt M, Brawanski A, Bogdahn U, Beier CP. 2008. CD133 expression and cancer stem cells predict prognosis in high-grade oligodendroglial tumors. Brain Pathol. 18:370–377 - PMC - PubMed
    1. Bidlingmaier S, Zhu X, Liu B. 2008. The utility and limitations of glycosylated human CD133 epitopes in defining cancer stem cells. J Mol Med. 86:1025–1032 - PMC - PubMed
    1. Brehar FM, Bleotu C, Stefan LM, Buzgariu W, Chivu M, Utoiu E, Matei L, Ciurea AV, Tascu A. 2009. Isolation and partial characterization of a new human glioblastoma cell line. Chirurgia. 104:453–461 - PubMed

Publication types

MeSH terms