. 2011 Aug;18(8):750-64.
doi: 10.1038/gt.2011.15. Epub 2011 Mar 17.

Lentiviral vectors for induction of self-differentiation and conditional ablation of dendritic cells

Affiliations
Free PMC article

Lentiviral vectors for induction of self-differentiation and conditional ablation of dendritic cells

M Pincha et al. Gene Ther. 2011 Aug.
Free PMC article

Abstract

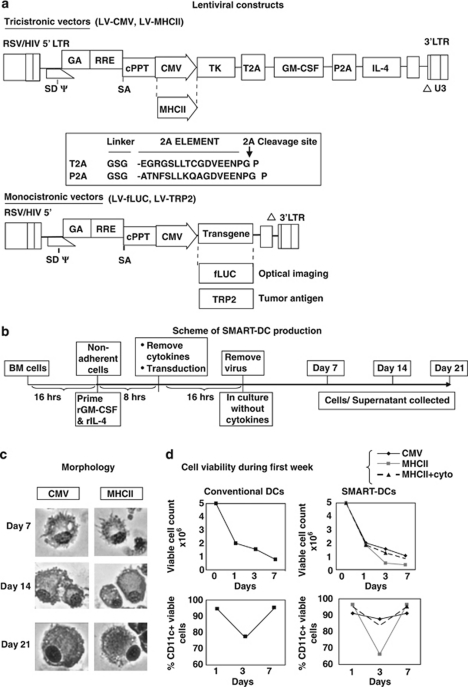
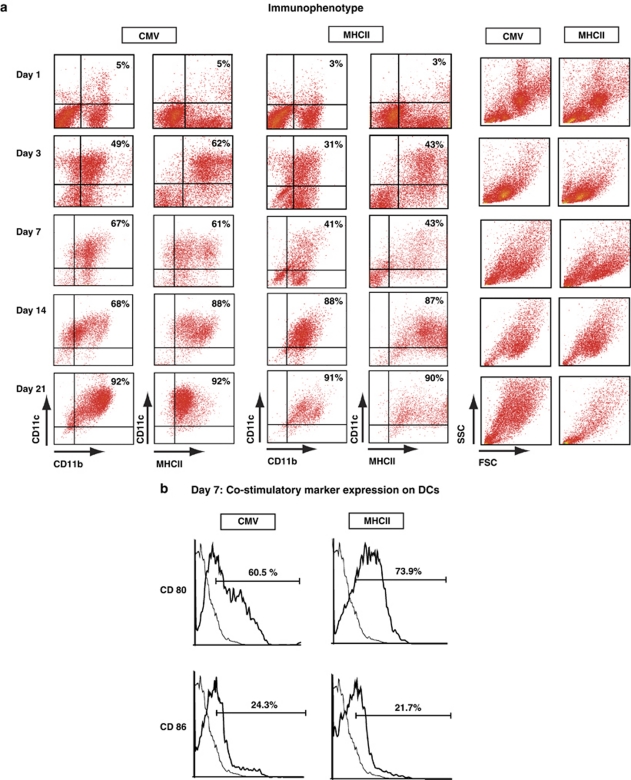
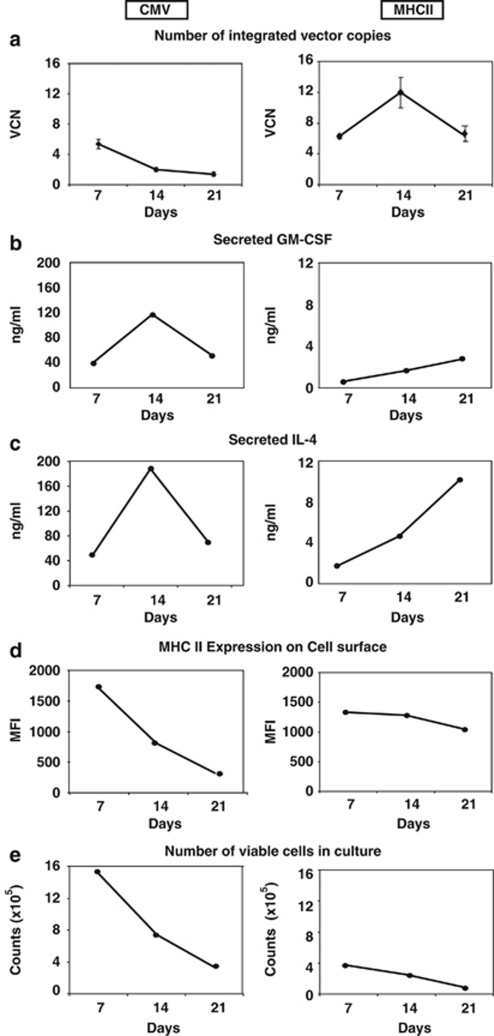
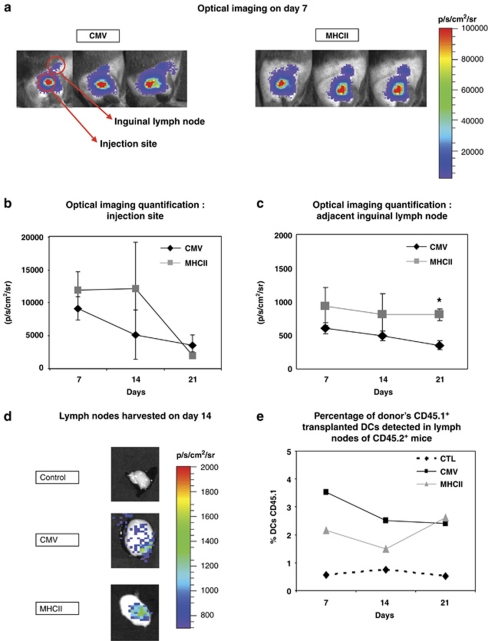
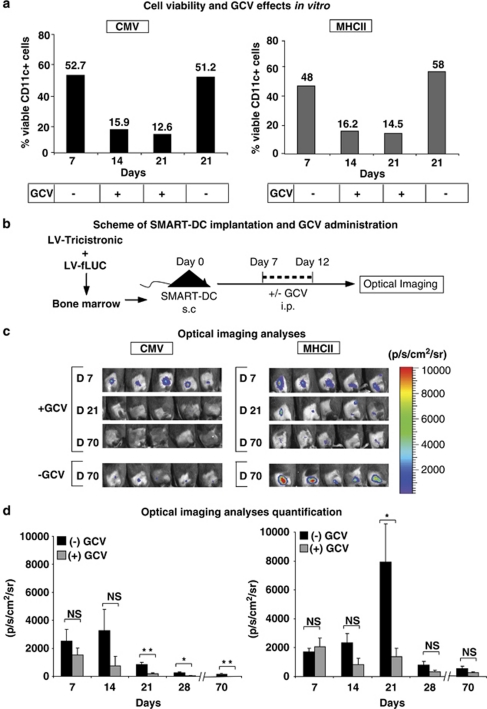
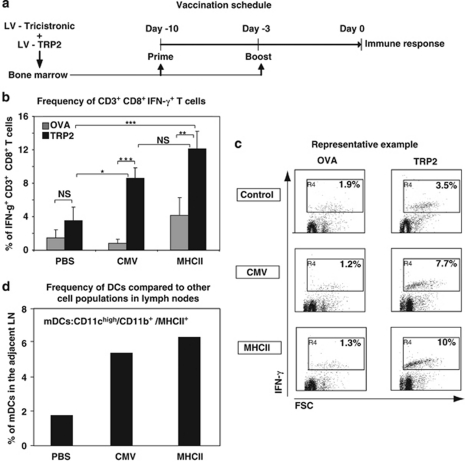
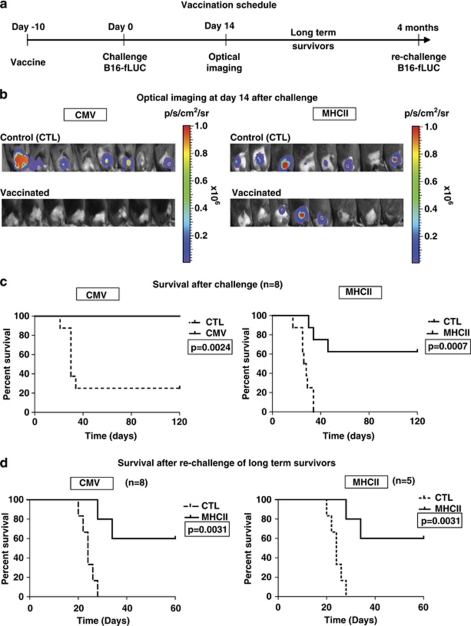
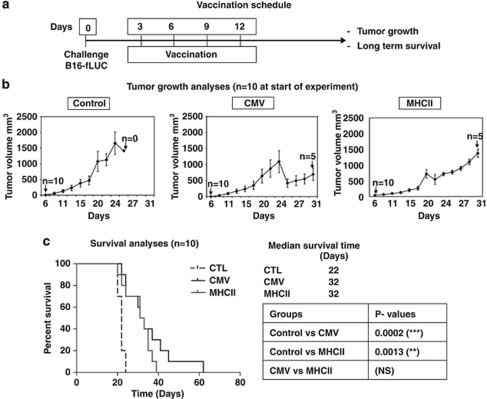
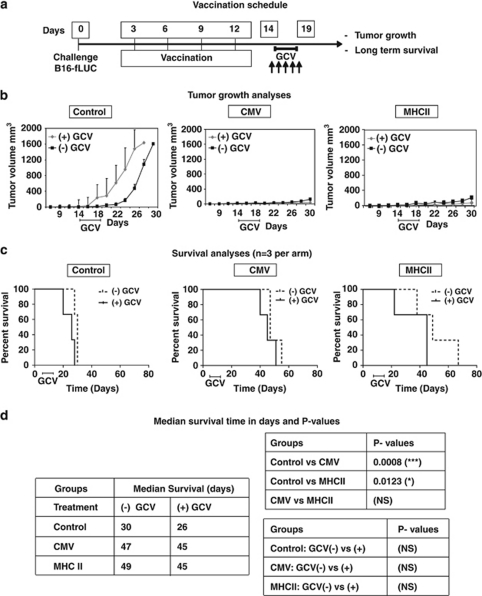
Development of lentiviral vectors (LVs) in the field of immunotherapy and immune regeneration will strongly rely on biosafety of the gene transfer. We demonstrated previously the feasibility of ex vivo genetic programming of mouse bone marrow precursors with LVs encoding granulocyte macrophage colony-stimulating factor (GM-CSF) and interleukin-4 (IL-4), which induced autonomous differentiation of long-lived dendritic cells (DCs), referred to as self-differentiated myeloid-derived antigen-presenting-cells reactive against tumors (SMART-DCs). Here, LV biosafety was enhanced by using a DC-restricted and physiological promoter, the major histocompatibility complex (MHC) II promoter, and including co-expression of the herpes simplex virus-thymidine kinase (sr39HSV-TK) conditional suicide gene. Tricistronic vectors co-expressing sr39HSV-TK, GM-CSF and IL-4 transcriptionally regulated by the MHCII promoter or the ubiquitous cytomegalovirus (CMV) promoter were compared. Despite the different gene transfer effects, such as the kinetics, levels of transgene expression and persistency of integrated vector copies, both vectors induced highly viable SMART-DCs, which persisted for at least 70 days in vivo and could be ablated with the pro-drug Ganciclovir (GCV). SMART-DCs co-expressing the tyrosine-related protein 2 melanoma antigen administered subcutaneously generated antigen-specific, anti-melanoma protective and therapeutic responses in the mouse B16 melanoma model. GCV administration after immunotherapy did not abrogate DC vaccination efficacy. This demonstrates proof-of-principle of genetically programmed DCs that can be ablated pharmacologically.


Figures

Figure 1
Figure 1
Vector design and immunophenotypic analyses: (a) tricistronic vectors: diagram representing the tricistronic vectors simultaneously co-expressing suicide gene sr39HSV-TK, GM-CSF and IL-4 with the immediate early CMV promoter or with MHCII promoter. The tricistronic construct contain two 2A-like sequences (the porcine teschovirus (P2A) and the Thosea asigna virus (T2A) upstream of mouse GM-CSF and mouse IL-4 open-reading frames. The amino acid sequences of the two heterologous 2A elements are indicated, and the cleavage sites for the protein products are indicated by the arrow. Monocistronic vectors: diagram representing the monocistronic vectors encoding melanoma-associated tumor antigen TRP2 or fLUC. (b) Schematic representation of SMART-DC production and analyses. (c) May–Grunwald Giemsa stain of cytospin preparations, performed at each time point showing the typical morphology of DCs. Representative data from three independent experiments are shown. (d) Viability at early time points was evaluated as total cell counts (obtained by trypan blue exclusion staining) and as percentage of viable CD11c+ cells (negative for Annexin V and 7-AAD staining).
Figure 2
Figure 2
SMART-DC immunophenotype: (a) flow cytometry analyses of CMV-SMART-DCs versus MHCII-SMART-DCs on days 1, 3, 7, 14 and 21 of culture, resulting in a typical myeloid DC immunophenotype: CD11chigh, CD11b+ and MHCII+. The forward and side scatter plots show the distribution of the cell populations over time. (b) Histogram analyses of CD11c+/MHCII+-positive CMV-SMART-DCs and MHCII-SMART-DCs, representing frequency of cells expressing CD80 and CD86 co-stimulatory markers. Representative data from three independent experiments are shown.
Figure 3
Figure 3
Kinetics of CMV-SMART-DC versus MHCII-SMART-DC cell cultures: (a) vector copy number (VCN) of SMART-DCs quantified by RT-Q-PCR, representing copies per cell genome. Average calculated from triplicate RT-Q-PCR reactions performed with samples of two independent experiments, error bars represent mean+s.d. (b) Accumulated level of secreted GM-CSF in SMART-DCs supernatants determined by enzyme-linked immunosorbent assay (ELISA). (c) Accumulated level of secreted IL-4 in SMART-DCs supernatants determined by ELISA. (d) Mean fluorescent intensity (MFI) detected by flow cytometry of MHCII expression on CD11c+ DCs. (e) Total number of viable cell counts (counts) obtained by trypan blue exclusion staining of SMART-DC cultures. Average calculated from two independent experiments is shown.
Figure 4
Figure 4
DC migration analyses: (a) optical imaging analyses of sites injected with SMART-DC/fLUC on day 7. Note signal branching out toward the region of the adjacent inguinal lymph node. (b) Quantified values of bioluminescence signal expressed as photon per sec per cm2 per steridian (p/s/cm2/sr) detected on the region of injection at different time points (n=3). (c) Quantified values of bioluminescence signal on the region corresponding to the location of the adjacent inguinal lymph node at different time points. (d) Optical imaging analyses of collected inguinal lymph nodes (LN) located adjacent to the injection site. Note enlarged LNs showing detectable bioluminescent signal in mice injected with CMV-SMART-DC/fLUC or MHCII-SMART-DC/fLUC. (e) Frequency of CD11c+/MHCII+ DCs of donor origin (CD45.1+) detectable in lymph nodes of CD45.2+ vaccinated mice. Error bars represent mean+s.e.m. (N=3 for CMV/MHCII-SMART-DC, N=2 for control CTL). P-values were calculated by paired two-tailed Student's t-test *P<0.05.
Figure 5
Figure 5
Cell viability and conditional ablation with GCV in vitro and in vivo: (a) GCV was added every fourth day (from days 7 to 21) to the culture medium of SMART-DCs and the percentage of viable CD11c+ cells detected by propidium iodide staining was obtained. Values reflect average from two independent experiments. (b) Schematic representation of SMART-DC injection and GCV administration. SMART-DCs (5 × 10⁵) co-transduced with LV-CMV or LV-MHCII (5 μg ml−1 p24 equivalent) plus LV-fLUC (5 μg ml−1 p24 equivalent) were injected s.c. (on day 0), followed by GCV administration i.p. (from day 7–12) and optical imaging analyses (on days 7, 14, 21, 28 and 70). (c) Photographs obtained by optical imaging analyses of the SMART-DC/fLUC injection sites at different times. Mice not administered with GCV showed high levels of viable SMART-DCs on the injection site during the first 21 days. (d) Histograms showing the average of quantified values of bioluminescence signal detected on the SMART-DC injection sites (region of interest) for controls (−) or GCV-treated mice (+). Error bars represent mean+s.d. (N=5). P-values were calculated by paired two-tailed Student's t-test. *P<0.05, **P<0.01, NS, not significant.
Figure 6
Figure 6
Antigen-specific T-cell responses generated by CMV-SMART-DCs versus MHCII-SMART-DCs in vivo: (a) SMART-DCs (1 × 10⁵) co-transduced with LV-CMV or LV-MHCII (5 μg ml−1 p24 equivalent) plus LV-TRP2 (5 μg ml−1 p24 equivalent) were used for prime/boost vaccination of C57BL/6 mice on days −10 and −3. On day 0, splenocytes and inguinal lymph nodes were collected for analyses. (b) Percentage of CD3+ CD8+ IFN-γ+ T cells detectable after in vitro priming of splenocytes with the TRP2 peptide or with the OVA control peptide (PBS represents the non-vaccinated mice) (N=3). Error bars represent mean+s.d. P-values were calculated by paired two-tailed Student's t-test. *P<0.05, **P<0.01; ***P<0.001, NS, not significant. (c) Representative example of CD3+ CD8+ IFN-γ+ T cells re-primed in vitro with TRP2 or control peptide OVA. (d) Percentage of cells with myeloid DC (CD11chigh/CD11b+/MHCII+) immunophenotype detectable in the inguinal lymph nodes adjacent to the SMART-DC injection sites (N=2).
Figure 7
Figure 7
Protective vaccinations with CMV-SMART-DCs versus MHCII-SMART-DCs followed by melanoma challenge: (a) Schedule of vaccination and challenge. A single vaccination of 1 × 10⁵ SMART-DCs co-transduced with LV-CMV or LV-MHCII (2 μg ml−1 p24 equivalent) plus LV-TRP2 (2 μg ml−1 p24 equivalent) was performed on day −10 and a lethal challenge with 5 × 10⁴ B16-fLUC was performed on day 0. On day 14, tumor growth was monitored by optical imaging analyses. Long-term survival of tumor-free mice was followed for 4 months (120 days). Long-term survivors were then rechallenged with 5 × 10⁴ B16-fLUC cells. (b) Optical imaging analyses of tumors on day 14 for the PBS ‘control' (CTL) and the SMART-DC vaccinated groups. (c) Kaplan–Meier survival curve after first challenge (N=8). (d) Kaplan–Meier survival curve after re-challenge of long-term survivors. (N=8 for CMV-SMART-DC; N=5 for MHCII SMART-DC). P-values were calculated by log-rank Mantel–Cox test.
Figure 8
Figure 8
Therapeutic vaccinations with CMV-SMART-DC versus MHCII-SMART-DC after melanoma challenge: (a) schematic representation of the B16-fLUC melanoma challenge on day 0 followed by four doses of vaccine on days 3, 6, 9 and 12 with 1 × 10⁵ SMART-DCs co-transduced with LV-CMV/MHCII (2 μg ml−1 p24 equivalent) plus LV-TRP2 (2 μg/ml p24 equivalent). (b) Kinetics of tumor growth (volume mm3) as an average (N=10) for PBS control and SMART-DC-vaccinated mice. Error bars represent mean+s.e.m. (c) Kaplan–Meier long-term survival curve analyses (N=10). P-values were calculated by log-rank Mantel–Cox test.
Figure 9
Figure 9
Therapeutic vaccinations with SMART-DCs and treatment with GCV: (a) schematic representation of therapeutic vaccination. B16-fLUC cells were used for melanoma challenge on day 0 and four doses of 1 × 10⁵ SMART-DCs co-transduced with LV-CMV or LV-MHCII (2 μg ml−1 p24 equivalent) plus LV-TRP2 (2 μg ml−1 p24 equivalent) were injected on days 3, 6, 9 and 12. On day 14, mice (N=3) were treated with GCV injected i.p. for 5 days. (b) Kinetics of tumor growth (volume mm3) as an average (N=3) per group for PBS controls and SMART-DC-vaccinated mice with or without GCV administration. Error bars represent mean+s.e.m. (c) Kaplan–Meier long-term survival curve analyses (N=3). (d) Median survival in days and P-values. P-values were calculated by log-rank Mantel–Cox test.

References

    1. Banchereau J, Palucka AK. Dendritic cells as therapeutic vaccines against cancer. Nat Rev Immunol. 2005;5:296–306. - PubMed
    1. Nestle FO, Alijagic S, Gilliet M, Sun Y, Grabbe S, Dummer R, et al. Vaccination of melanoma patients with peptide- or tumor lysate-pulsed dendritic cells. Nat Med. 1998;4:328–332. - PubMed
    1. Thurner B, Haendle I, Roder C, Dieckmann D, Keikavoussi P, Jonuleit H, et al. Vaccination with mage-3A1 peptide-pulsed mature, monocyte-derived dendritic cells expands specific cytotoxic T cells and induces regression of some metastases in advanced stage IV melanoma. J Exp Med. 1999;190:1669–1678. - PMC - PubMed
    1. Palucka AK, Dhodapkar MV, Paczesny S, Ueno H, Fay J, Banchereau J. Boosting vaccinations with peptide-pulsed CD34+ progenitor-derived dendritic cells can expand long-lived melanoma peptide-specific CD8+ T cells in patients with metastatic melanoma. J Immunother. 2005;28:158–168. - PubMed
    1. Banchereau J, Ueno H, Dhodapkar M, Connolly J, Finholt JP, Klechevsky E, et al. Immune and clinical outcomes in patients with stage IV melanoma vaccinated with peptide-pulsed dendritic cells derived from CD34+ progenitors and activated with type I interferon. J Immunother. 2005;28:505–516. - PubMed

Publication types