. 2011 Mar 11;6(3):e17455.
doi: 10.1371/journal.pone.0017455.

Drop-on-demand single cell isolation and total RNA analysis

Affiliations

Drop-on-demand single cell isolation and total RNA analysis

Sangjun Moon et al. PLoS One. .

Abstract

Technologies that rapidly isolate viable single cells from heterogeneous solutions have significantly contributed to the field of medical genomics. Challenges remain both to enable efficient extraction, isolation and patterning of single cells from heterogeneous solutions as well as to keep them alive during the process due to a limited degree of control over single cell manipulation. Here, we present a microdroplet based method to isolate and pattern single cells from heterogeneous cell suspensions (10% target cell mixture), preserve viability of the extracted cells (97.0±0.8%), and obtain genomic information from isolated cells compared to the non-patterned controls. The cell encapsulation process is both experimentally and theoretically analyzed. Using the isolated cells, we identified 11 stem cell markers among 1000 genes and compare to the controls. This automated platform enabling high-throughput cell manipulation for subsequent genomic analysis employs fewer handling steps compared to existing methods.


Conflict of interest statement

Competing Interests: The authors have declared that no competing interests exist.

Figures

Figure 1
Figure 1. Description of a conventional procedure for total RNA expression analysis versus the technique described.
(a) Conventional single cell isolation method for total RNA expression analysis. 1) Heterogeneous sample was collected from a specific tissue, macro-dissection, 2) cells were stained with a specific antibody, 3) target cells were collected with conventional FACS, 4) multiple dilution steps generated a small population of target cells, 5) total RNA gene expression analysis with microarray. (b) Drop-on-demand total RNA analysis approach. 1) Heterogeneous sample was collected, 2) cells were stained with antibody and patterned with cell-encapsulating droplets, 3) specific homogeneous samples containing target cells were produced by a cell droplet patterning platform; homogeneous samples were identified by an automated imaging system, 4) total RNA gene expression analysis with microarray.
Figure 2
Figure 2. Patterned droplets.
(a) Schematic droplet subarray showing four different cases of patterned droplets. Green colored circles indicated target cells. (b) Portion of a droplet array showing examples of each of the four different cases of patterned droplets, 1) single target cell droplet, 2) an empty droplet without cells, 3) a non-target cell droplet, and 4) a heterogeneous droplet containing target and non-target cells. Green fluorescent stained cells were target cells. Scale bars, 200 µm.
Figure 3
Figure 3. Homogeneous droplet analyses.
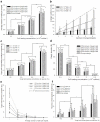
(a) Droplets are generated at cell concentrations: 0.5×10⁵, 1.0×10⁵, 1.5×10⁵, and 2.0×10⁵ cells/ml and they contained 0.28±0.12, 0.88±0.14, 1.50±0.10, and 2.20±0.19 cells per droplet, respectively (mean ± standard deviation). The droplets were ejected using two controlled parameters: 34 kPa nitrogen gas pressure and 55 µs valve opening period. Values were obtained from 5 groups, each containing 100 droplets. Each group was tested by single factor analysis of variance (ANOVA). F(3,16) = 0.15, 0.58, 1.22, and 0.16, n = 5 mean values per each group, *p>0.33. (Student's t-test between target cell concentrations: **p<0.0004, n = 5 mean values of 4 concentrations). (b) Number of cells in droplets was obtained at cell concentrations: 2.5×10⁵, 5.0×10⁵, and 7.5×10⁵ cells/ml. Regression coefficients, R2 values, were *0.93 (1.7 cells/drop), **0.96 (3.6 cells/drop), and ***0.92 (6.6 cells/drop), n = 28 droplets. (c) Comparing target cell concentration in the reservoir and in the droplet pattern. Average and standard deviation of 10% to 50% target cell concentration in the reservoir were 10.3±0.6, 19.0±1.0, 27.8±2.0, and 45.1±2.1. F(3,16) = 0.82, 1.38, 0.98, and 0.52, *p>0.29, ANOVA for each cell concentration (student's t-test for each target cell concentration: **p<0.001, n = 5 mean values of 4 different target cell concentrations). (d) Fraction of empty droplets in droplet array as a function of cell concentration. Average and standard deviation of empty droplets for 0.5 to 2.5×10⁵ cells/ml concentrations were 72.8±12.8%, 40.6±7.7%, 23.8±4.0%, 12.7±5.8%, and 2.2±0.3%, respectively. F(3,16) = 0.05, 0.64, 0.56, 0.05, and 0.67, *p>0.58, ANOVA for each target cell concentration (student's t-test for each cell concentration: **p<0.016, n = 5 mean values of 4 different target cell concentrations). (e) Fraction of target homogeneous droplets among the patterned droplets was calculated as the ratio between the number of cells in homogenous droplets and the overall number of droplets for different cases: 1, 2, 3, 4, and 5 cells per droplet. This excluded the empty droplets. At 1.0×10⁵, for the case of one cell per droplet, the average and standard deviation values of homogeneity were 9.5±1.4%, 18.8±3.7%, 26.0±3.1%, and 45.5±8.8% for 10 to 50% target cell concentration. The fractions were 0.4±0.9%, 3.1±2.1%, 5.1±4.2%, and 9.6±4.8% for droplets containing two cells. (f) Frequency of homogeneous droplets based on cell concentration. This analysis includes the empty droplets. Among the different target cell concentrations, the 1×10⁵ cells/ml concentration showed 4.7±0.6%, 9.0±1.9%, 12.7±1.6%, and 21.6±5.2% homogeneous droplet occurrences. F(1,8) = 22.7, 11.2, and 13.3, *p<0.01, ANOVA for 1×10⁵ cells/ml through 10 to 50% target cell concentration (student t-test: **p = 0.12, ***p<0.05, n = 5). Error bars represented the standard deviation of the mean. The p values in student's t-test were calculated based on two-sided distributions with unequal variances.
Figure 4
Figure 4. Total RNA expressions in printed droplets (virtual gel).
(a) Total RNA quality on virtual gels (Agilent bioanalyser) as number of droplets increase. The 96-well plate was then placed underneath the ejector and one droplet was ejected into each of the first nine wells of the first row of wells. This procedure was repeated with additional four rows of the plate, where two, three, four and five droplets were ejected in each well resulting to a total of five groups of droplet samples, each group having an increasing droplet volume and increasing number of cells ranging from ten to fifty cells. For extraction purposes and consistency, before the RNA analysis was performed, each row was divided into three triplicates. Hence, the analysis was based on average 30, 60, 90, 120, and 150 cells for each triplicate for bioanalysis. To investigate nonprinted cells, 0.5 µl samples were drawn from the cell solution and pipetted into the three wells in each of the first three rows of the plate as controls. The controls had 1000 cells on average. The last lane showed the results for the control RNA which was prepared by a manual dilution method without ejection. (b, c) Comparison of the reproducibility of the RNA expression levels for (b) two replicates of the control set by the manual pipette method and (c) two experimental RNA samples obtained by droplet method. The scatter-plots were compared the reproducibility of expression level measurements for the 1000 genes with the highest expression levels in the experimental samples. (d) Expression of stem cell-related markers was examined to assess whether RNA obtained from the cell encapsulating droplets provided useful biological information in comparison to control samples. Our results showed that these 11 stem cell markers including Kit and Notch1, were found in both the patterned cells and the control groups.

References

    1. Marson A, Levine SS, Cole MF, Frampton GM, Brambrink T, et al. Connecting microRNA Genes to the Core Transcriptional Regulatory Circuitry of Embryonic Stem Cells. Cell. 2008;134:521–533. - PMC - PubMed
    1. Bianco P, Robey PG. Stem cells in tissue engineering. Nature. 2001;414:118–121. - PubMed
    1. Takahashi K, Tanabe K, Ohnuki M, Narita M, Ichisaka T, et al. Induction of Pluripotent Stem Cells from Adult Human Fibroblasts by Defined Factors. Cell. 2007;131:861–872. - PubMed
    1. Zipori D. The Stem State: Plasticity Is Essential, Whereas Self-Renewal and Hierarchy Are Optional. Stem Cells. 2005;23:719–726. - PubMed
    1. Slack JMW. Origin of Stem Cells in Organogenesis. Science. 2008;322:1498–1501. - PubMed

Publication types