

Adjunctive dexamethasone affects the expression of genes related to inflammation, neurogenesis and apoptosis in infant rat pneumococcal meningitis
- PMID: 21412436
- PMCID: PMC3055894
- DOI: 10.1371/journal.pone.0017840
Adjunctive dexamethasone affects the expression of genes related to inflammation, neurogenesis and apoptosis in infant rat pneumococcal meningitis
Abstract
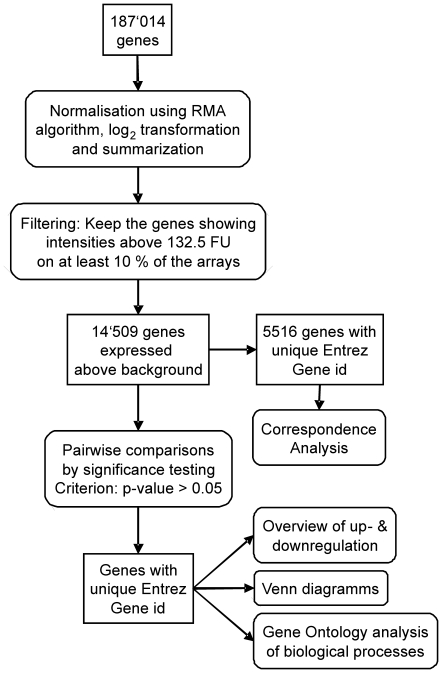
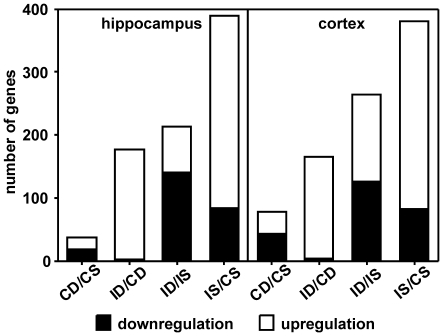
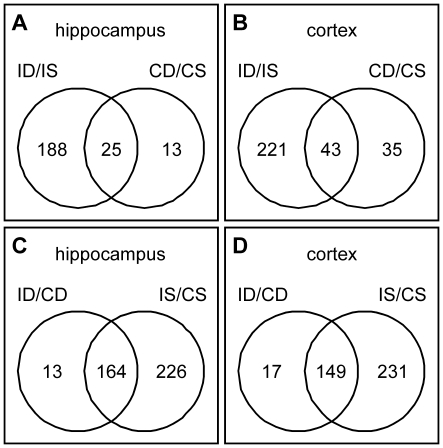
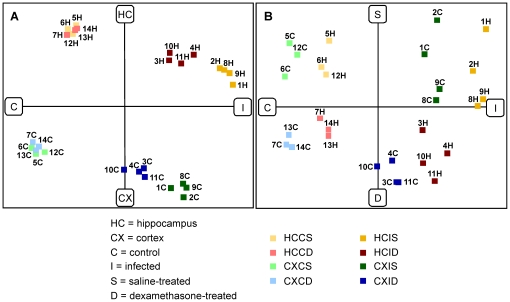
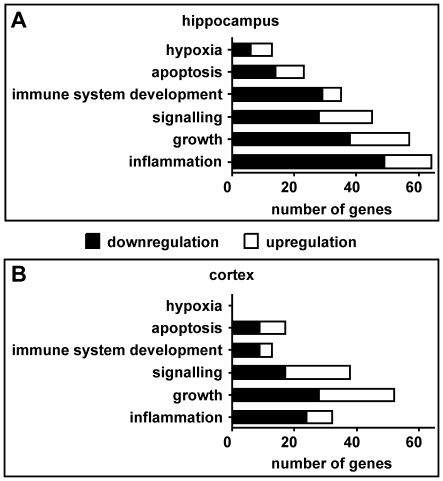
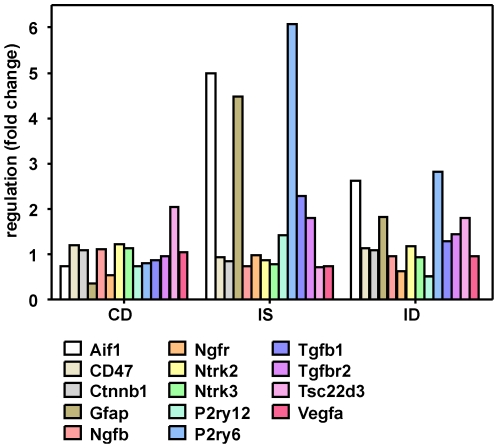
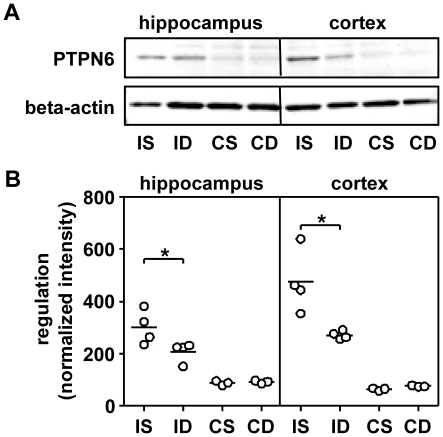
Streptococcus pneumoniae is the most common pathogen causing non-epidemic bacterial meningitis worldwide. The immune response and inflammatory processes contribute to the pathophysiology. Hence, the anti-inflammatory dexamethasone is advocated as adjuvant treatment although its clinical efficacy remains a question at issue. In experimental models of pneumococcal meningitis, dexamethasone increased neuronal damage in the dentate gyrus. Here, we investigated expressional changes in the hippocampus and cortex at 72 h after infection when dexamethasone was given to infant rats with pneumococcal meningitis. Nursing Wistar rats were intracisternally infected with Streptococcus pneumoniae to induce experimental meningitis or were sham-infected with pyrogen-free saline. Besides antibiotics, animals were either treated with dexamethasone or saline. Expressional changes were assessed by the use of GeneChip® Rat Exon 1.0 ST Arrays and quantitative real-time PCR. Protein levels of brain-derived neurotrophic factor, cytokines and chemokines were evaluated in immunoassays using Luminex xMAP® technology. In infected animals, 213 and 264 genes were significantly regulated by dexamethasone in the hippocampus and cortex respectively. Separately for the cortex and the hippocampus, Gene Ontology analysis identified clusters of biological processes which were assigned to the predefined categories "inflammation", "growth", "apoptosis" and others. Dexamethasone affected the expression of genes and protein levels of chemokines reflecting diminished activation of microglia. Dexamethasone-induced changes of genes related to apoptosis suggest the downregulation of the Akt-survival pathway and the induction of caspase-independent apoptosis. Signalling of pro-neurogenic pathways such as transforming growth factor pathway was reduced by dexamethasone resulting in a lack of pro-survival triggers. The anti-inflammatory properties of dexamethasone were observed on gene and protein level in experimental pneumococcal meningitis. Further dexamethasone-induced expressional changes reflect an increase of pro-apoptotic signals and a decrease of pro-neurogenic processes. The findings may help to identify potential mechanisms leading to apoptosis by dexamethasone in experimental pneumococcal meningitis.
Conflict of interest statement
Figures
Similar articles
-
Brain-derived neurotrophic factor reduces inflammation and hippocampal apoptosis in experimental Streptococcus pneumoniae meningitis.J Neuroinflammation. 2017 Aug 4;14(1):156. doi: 10.1186/s12974-017-0930-6. J Neuroinflammation. 2017. PMID: 28778220 Free PMC article.
-
Resveratrol Acts Anti-Inflammatory and Neuroprotective in an Infant Rat Model of Pneumococcal Meningitis by Modulating the Hippocampal miRNome.Mol Neurobiol. 2018 Dec;55(12):8869-8884. doi: 10.1007/s12035-018-1037-5. Epub 2018 Apr 2. Mol Neurobiol. 2018. PMID: 29611100
-
Neonatal overfeeding attenuates microgliosis and hippocampal damage in an infant rat model of pneumococcal meningitis.Front Immunol. 2024 Oct 14;15:1429157. doi: 10.3389/fimmu.2024.1429157. eCollection 2024. Front Immunol. 2024. PMID: 39469711 Free PMC article.
-
Experimental studies of pneumococcal meningitis.Dan Med Bull. 2010 Jan;57(1):B4119. Dan Med Bull. 2010. PMID: 20175949 Review.
-
Current concepts in the pathogenesis of meningitis caused by Streptococcus pneumoniae.Curr Opin Infect Dis. 2002 Jun;15(3):253-7. doi: 10.1097/00001432-200206000-00007. Curr Opin Infect Dis. 2002. PMID: 12015459 Review.
Cited by
-
Brain-derived neurotrophic factor is regulated via MyD88/NF-κB signaling in experimental Streptococcus pneumoniae meningitis.Sci Rep. 2017 Jun 14;7(1):3545. doi: 10.1038/s41598-017-03861-z. Sci Rep. 2017. PMID: 28615695 Free PMC article.
-
Controversial roles for dexamethasone in glioblastoma - Opportunities for novel vascular targeting therapies.J Cereb Blood Flow Metab. 2019 Aug;39(8):1460-1468. doi: 10.1177/0271678X19859847. Epub 2019 Jun 25. J Cereb Blood Flow Metab. 2019. PMID: 31238763 Free PMC article. Review.
-
Adjunctive daptomycin attenuates brain damage and hearing loss more efficiently than rifampin in infant rat pneumococcal meningitis.Antimicrob Agents Chemother. 2012 Aug;56(8):4289-95. doi: 10.1128/AAC.00674-12. Epub 2012 May 29. Antimicrob Agents Chemother. 2012. PMID: 22644021 Free PMC article.
-
Matrix metalloproteinase inhibition lowers mortality and brain injury in experimental pneumococcal meningitis.Infect Immun. 2014 Apr;82(4):1710-8. doi: 10.1128/IAI.00073-14. Epub 2014 Feb 3. Infect Immun. 2014. PMID: 24491581 Free PMC article.
-
Inhibition of Hippocampal Regeneration by Adjuvant Dexamethasone in Experimental Infant Rat Pneumococcal Meningitis.Antimicrob Agents Chemother. 2016 Jan 11;60(3):1841-6. doi: 10.1128/AAC.02429-15. Antimicrob Agents Chemother. 2016. PMID: 26824948 Free PMC article.
References
-
- Swartz MN. Bacterial meningitis—a view of the past 90 years. N Engl J Med. 2004;351:1826–1828. - PubMed
-
- Koedel U, Klein M, Pfister HW. New understandings on the pathophysiology of bacterial meningitis. Curr Opin Infect Dis. 2010;23:217–223. - PubMed
-
- Andersen CO. Streptococcus penumoniae meningitis. Clinical and experimental studies. Dan Med Bull. 2007;54:189–209. - PubMed
-
- Schuchat A, Robinson K, Wenger JD, Harrison LH, Farley M, et al. Bacterial meningitis in the United States in 1995. Active Surveillance Team. N Engl J Med. 1997;337:970–976. - PubMed
Publication types
MeSH terms
Substances
LinkOut - more resources
Full Text Sources
Molecular Biology Databases
