. 2011 Apr;65(4):1195-206.
doi: 10.1002/mrm.22701. Epub 2010 Nov 30.

Statistical noise analysis in GRAPPA using a parametrized noncentral Chi approximation model

Affiliations

Statistical noise analysis in GRAPPA using a parametrized noncentral Chi approximation model

Santiago Aja-Fernández et al. Magn Reson Med. 2011 Apr.

Abstract

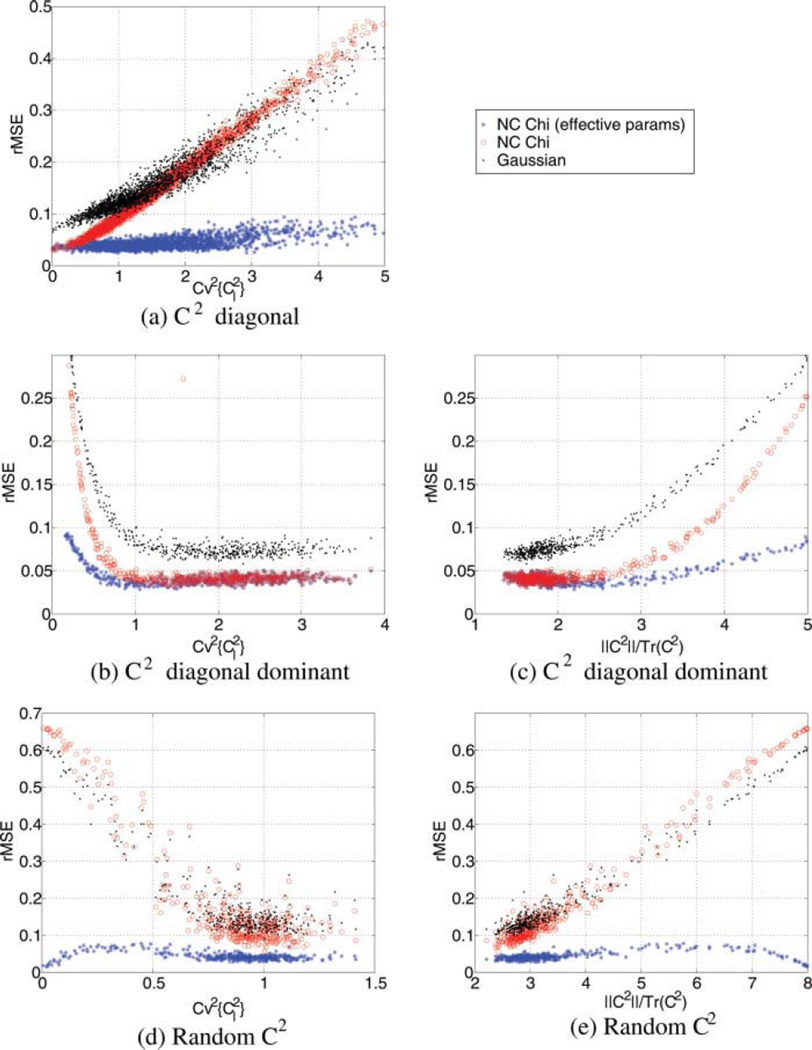
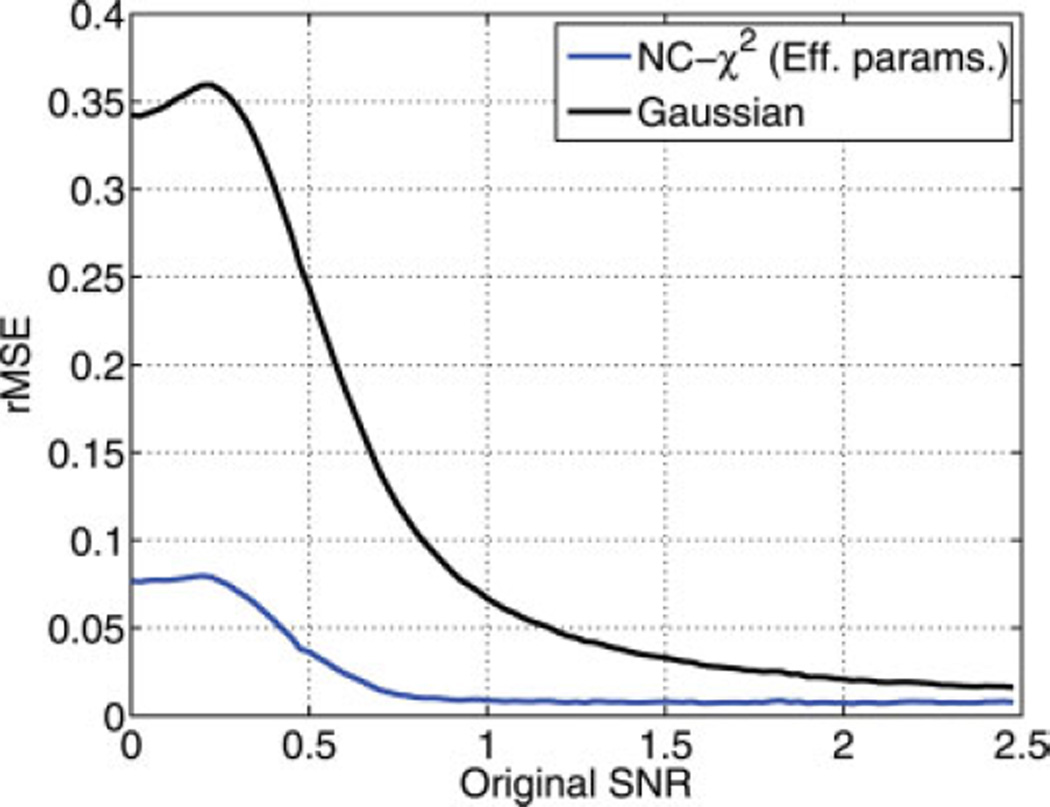
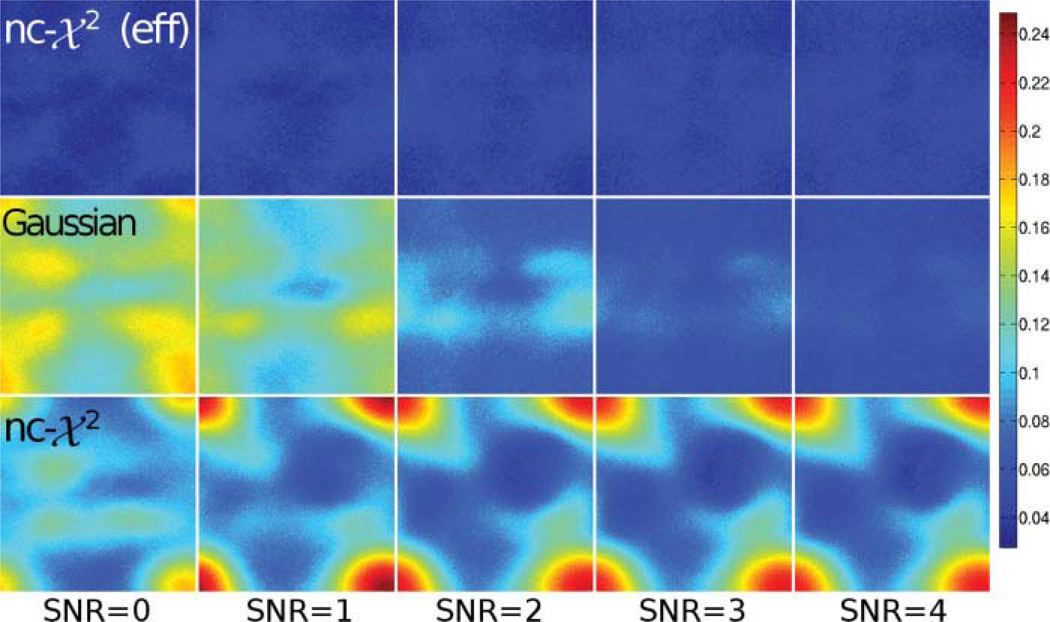
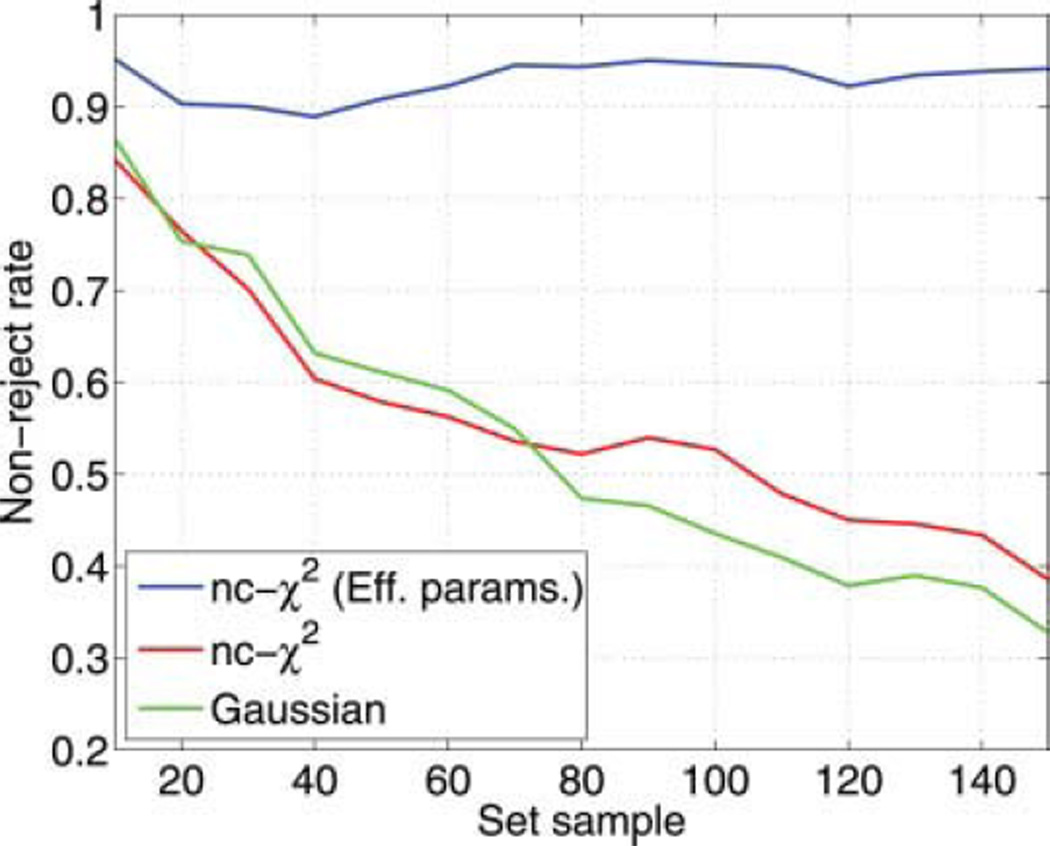
The characterization of the distribution of noise in the magnitude MR image is a very important problem within image processing algorithms. The Rician noise assumed in single-coil acquisitions has been the keystone for signal-to-noise ratio estimation, image filtering, or diffusion tensor estimation for years. With the advent of parallel protocols such as sensitivity encoding or Generalized Autocalibrated Partially Parallel Acquisitions that allow accelerated acquisitions, this noise model no longer holds. Since Generalized Autocalibrated Partially Parallel Acquisitions reconstructions yield the combination of the squared signals recovered at each receiving coil, noncentral Chi statistics have been previously proposed to model the distribution of noise. However, we prove in this article that this is a weak model due to several artifacts in the acquisition scheme, mainly the correlation existing between the signals obtained at each coil. Alternatively, we propose to model such correlations with a reduction in the number of degrees of freedom of the signal, which translates in an equivalent nonaccelerated system with a minor number of independent receiving coils and, consequently, a lower signal-to-noise ratio. With this model, a noncentral Chi distribution can be assumed for all pixels in the image, whose effective number of coils and effective variance of noise can be explicitly computed in a closed form from the Generalized Autocalibrated Partially Parallel Acquisitions interpolation coefficients. Extensive experiments over both synthetic and in vivo data sets have been performed to show the goodness of fit of out model.


Figures

FIG. 1
FIG. 1
Data sets for the experiments.
FIG. 2
FIG. 2
Actual distribution of the SoS of the sum of weighted Normal RVs compared with nc-χ2 distribution approximation and Gaussian distribution. [Color figure can be viewed in the online issue, which is available at wileyonlinelibrary.com.]
FIG. 3
FIG. 3
Relative errors in the PDF for the non-central Chi approximation with effective parameters. For the sake of comparison, the noncentral Chi with fix parameters and the Gaussian distribution are also considered. [Color figure can be viewed in the online issue, which is available at wileyonlinelibrary.com.]
FIG. 4
FIG. 4
Evolution of the effective value of parameter L for the experiments in Fig 3(d–e). [Color figure can be viewed in the online issue, which is available at wileyonlinelibrary.com.]
FIG. 5
FIG. 5
Relative errors for the nc-χ2 approximation with effective parameters and Gaussian for different SNR values. [Color figure can be viewed in the online issue, which is available at wileyonlinelibrary.com.]
FIG. 6
FIG. 6
rMSE of different statistical approximations using the GRAPPA coefficients of dataset 1. Different original SNR are considered. Top row: nc-χ2 with effective parameters. Middle row: Gaussian. Bottom row: nc-χ2 with original parameters. [Color figure can be viewed in the online issue, which is available at wileyonlinelibrary.com.]
FIG. 7
FIG. 7
rMSE of different statistical approximations using the GRAPPA coefficients of dataset 2. Different original SNR are considered. Top row: nc-χ2 with effective parameters. Middle row: Gaussian. Bottom row: nc-χ2 with original parameters. [Color figure can be viewed in the online issue, which is available at wileyonlinelibrary.com.]
FIG. 8
FIG. 8
Average of the rMSE in the whole image for the different SNR values.
FIG. 9
FIG. 9
L effective for different SNR values. Top: Data set 1. Bottom: Data set 2.
FIG. 10
FIG. 10
σn effective for different SNR values. Top: Data set 1. Bottom: Data set 2.
FIG. 11
FIG. 11
Rate of sets passing the Kolmogorov–Smirnov test for the distributions under study as a function of the size of the population. Significance level is α = 0.05, and a SNR = 1. The data are synthetically generated from the GRAPPA coefficients of data set 1. [Color figure can be viewed in the online issue, which is available at wileyonlinelibrary.com.]

References

    1. McGibney G, Smith M. Unbiased signal-to-noise ratio measure for magnetic resonance images. Med Phys. 1993;20:1077–1078. - PubMed
    1. Sijbers J, den Dekker AJ, Van Dyck D, Raman E. Estimation of signal and noise from Rician distributed data. Proc. of the Int. Conf. on Signal Proc. and Comm.; Las Palmas de Gran Canaria, Spain. 1998. pp. 140–142.
    1. Aja-Fernández S, Alberola-López C, Westin CF. Noise and signal estimation in magnitude MRI and Rician distributed images: a LMMSE approach. IEEE Trans Image Proccess. 2008;17:1383–1398. - PubMed
    1. Wiest-Daesslé N, Prima S, Coupé P, Morrissey S, Barillot C. Rician noise removal by non-local means filtering for low signal-to-noise ratio MRI: Applications to DT-MRI. Lecture Notes in Computer Science, MICCAI 2008. 2008:171–179. - PMC - PubMed
    1. Constantinides C, Atalar E, McVeigh E. Signal-to-noise measurements in magnitude images from NMR based arrays. Magn Reson Med. 1997;38:852–857. - PMC - PubMed