. 2011 Mar 18:12:78.
doi: 10.1186/1471-2105-12-78.

ATAQS: A computational software tool for high throughput transition optimization and validation for selected reaction monitoring mass spectrometry

Affiliations

ATAQS: A computational software tool for high throughput transition optimization and validation for selected reaction monitoring mass spectrometry

Mi-Youn K Brusniak et al. BMC Bioinformatics. .

Abstract

Background: Since its inception, proteomics has essentially operated in a discovery mode with the goal of identifying and quantifying the maximal number of proteins in a sample. Increasingly, proteomic measurements are also supporting hypothesis-driven studies, in which a predetermined set of proteins is consistently detected and quantified in multiple samples. Selected reaction monitoring (SRM) is a targeted mass spectrometric technique that supports the detection and quantification of specific proteins in complex samples at high sensitivity and reproducibility. Here, we describe ATAQS, an integrated software platform that supports all stages of targeted, SRM-based proteomics experiments including target selection, transition optimization and post acquisition data analysis. This software will significantly facilitate the use of targeted proteomic techniques and contribute to the generation of highly sensitive, reproducible and complete datasets that are particularly critical for the discovery and validation of targets in hypothesis-driven studies in systems biology.

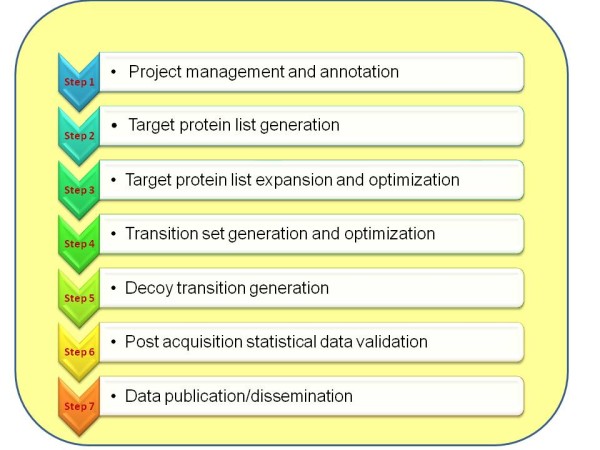
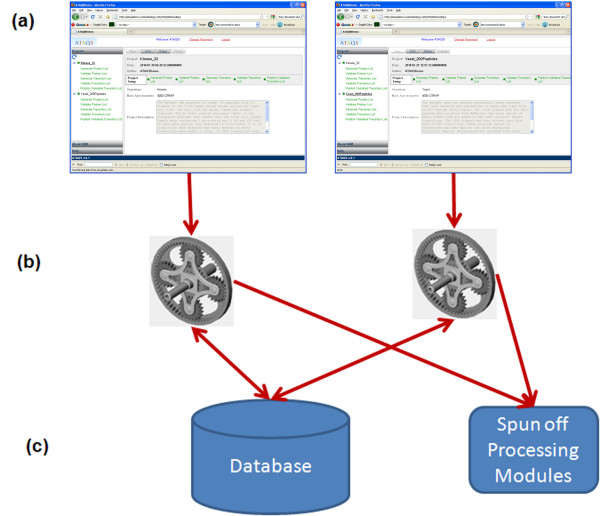
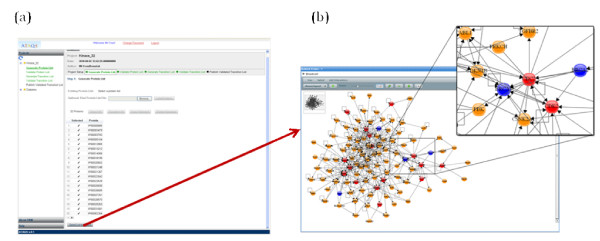
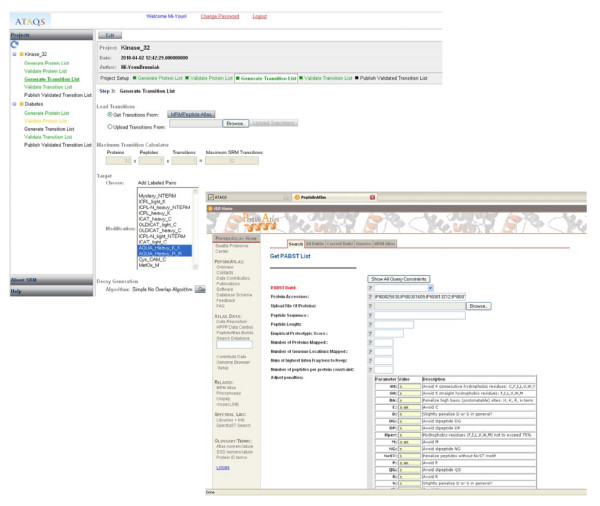
Result: We introduce a new open source software pipeline, ATAQS (Automated and Targeted Analysis with Quantitative SRM), which consists of a number of modules that collectively support the SRM assay development workflow for targeted proteomic experiments (project management and generation of protein, peptide and transitions and the validation of peptide detection by SRM). ATAQS provides a flexible pipeline for end-users by allowing the workflow to start or end at any point of the pipeline, and for computational biologists, by enabling the easy extension of java algorithm classes for their own algorithm plug-in or connection via an external web site.This integrated system supports all steps in a SRM-based experiment and provides a user-friendly GUI that can be run by any operating system that allows the installation of the Mozilla Firefox web browser.

Conclusions: Targeted proteomics via SRM is a powerful new technique that enables the reproducible and accurate identification and quantification of sets of proteins of interest. ATAQS is the first open-source software that supports all steps of the targeted proteomics workflow. ATAQS also provides software API (Application Program Interface) documentation that enables the addition of new algorithms to each of the workflow steps. The software, installation guide and sample dataset can be found in http://tools.proteomecenter.org/ATAQS/ATAQS.html.


Figures

Figure 1
Figure 1
Summary of ATAQS workflow. ATAQS is composed of seven steps. The data flow is flexible in that the user can select which steps they want to use in cases in which the whole pipeline is not used. For example, if the user has already generated and optimized the list of transitions and decoy transitions, then the user can skip steps 4 and 5. In each step, there are major options for user to select or define. In step 1, the experiment needs to be annotated by selecting exact mass spectrum instrument and organism. Also, the user can select other researchers who can share the project. In step 2, the user needs to provide or select a list of proteins. In step 3, the user can explore the selected proteins' properties and interactions by using PIPE2. Then, the user can extend the protein list or trim it down to a smaller number of proteins. In step 4, the user needs to define what type of peptides and transitions to be selected for a given protein by specifying penalties of amino acid compositions and fragment ion types. In step 5, the user will select to generate a decoy or heavy/light pairs based on user-selected decoy generating algorithms and labeling methods. In step 6, mzXML or mzML format of measured data set is selected and the user groups the experiments by transition list. Then, user can also select transition property measuring algorithm in this step. Based on the results of step 6, the user can choose a FDR cutoff to determine validated peptides in a given sample. In step 7, as an option, the user can create a TraML format of verified transitions to share with the community.
Figure 2
Figure 2
ATAQS System Overview. The ATAQS system is composed of three tiers: (a) shows a presentation tier. User interface ATAQS using Mozilla FireFox browser in any computer that can connect to ATAQS server. (b) illustrates a business logic tier. Servlet Coordinates the applications, by launching processing modules in processing system and interface with Database to store/retrieve data (c) illustrates the data storage and processing tier. Data are stored and retrieved and CPU heavy processing modules are running in a distributed CPU node system for high throughput.
Figure 3
Figure 3
PIPE2 connection. ATAQS provides an automatic connection to the PIPE2 web server. Figure (a) shows the location of the simple button to activate the PIPE2 connection and (b) illustrates the network viewer in PIPE2 for protein-protein interactions associated with the protein list from ATAQS using HPRD.
Figure 4
Figure 4
Transition list. ATAQS sends the protein list to the Peptide Atlas Best SRM Transition website and generates the best peptide set based on an empirical score that uses a user-defined penalty weight. For example, the user can increase the penalty value to 2 to avoid a methionine in the peptide sequence.
Figure 5
Figure 5
ATAQS validator. The ATAQS validator best peak group selection algorithm is capable of selecting the correct peak group when a strong false interference peak group is present.
Figure 6
Figure 6
Statistical Summary. ATAQS provides a graphical summary report. This figure illustrates the results from the yeast 18000 transition SRM measurements. (a) shows the separation of decoy and target transition distributions by a semi-learning algorithm and (b) shows the FDR and sensitivity curve with respect to the discriminant score cutoff. (c) shows the ROC curve for the data.
Figure 7
Figure 7
Statistical summary of kinase dataset. ATAQS provides a graphical summary report. This figure illustrates the results from the kinase transition SRM measurements. (a) shows the separation of decoy and target transition distributions by a semi-learning algorithm and (b) shows the FDR and sensitivity curve with respect to the discriminant score cutoff. (c) shows the ROC curve for the data.
Figure 8
Figure 8
Identified kinase peptide transitions in a cancer cell line. (a) shows the smoothed heavy and light transitions of the kinase peptide AQLSTILEEEK in three different heavy peptide-spiked samples. (b) shows the kinase peptide IISIFSGTEK transitions. (a) and (b) show how ATAQS calculates the properties described in the 'identification of confirmed transitions' guided peptide detection in the sample, in spite of the strong interference. (c) shows an example of a decoy peptide RNVSTESIEF, which is above the FDR score cutoff of <1.2% in validation.

References

    1. Domon B, Aebersold R. Options and considerations when selecting a quantitative proteomics strategy. Nat Biotechnology. 2010;28:710–721. doi: 10.1038/nbt.1661. - DOI - PubMed
    1. Anderson NK, Anderson NG, Pearson TQ, Borchers CH, Paulovich AG, Patterson SD, Gillette M, Aebersold R, Carr SA. Review, Human Proteome Detection and Quantitation Project: hPDQ. Mol Cell Proteomics. 2009;8:883–886. doi: 10.1074/mcp.R800015-MCP200. - DOI - PMC - PubMed
    1. Mallick P, Schirle M, Chen SS, Flory MR, Lee H, Martin D, Ranish J, Raught B, Schmitt R, Werner T, Kuster B, Aebersold R. Computational Prediction of Proteotypic Peptides for Quantitative Proteomics. Nat Biotechnol. 2007;25(1):125–31. doi: 10.1038/nbt1275. - DOI - PubMed
    1. Fusaro VA, Mani DR, Mesirov JP, Carr SA. Prediction of High-Responding Peptides for Targeted Protein Assay by Mass Spectrometry. Nature biotechnology. 2008;27:190. doi: 10.1038/nbt.1524. - DOI - PMC - PubMed
    1. Lange V, Picotti P, Domon B, Aebersold R. Review Selected Reaction Monitoring for Quantitative Proteomics. Molecular Systems Biology. 2008;4:222. doi: 10.1038/msb.2008.61. - DOI - PMC - PubMed

Publication types

LinkOut - more resources