. 2011 Feb 23;31(8):2769-80.
doi: 10.1523/JNEUROSCI.4991-10.2011.

TrkB (tropomyosin-related kinase B) controls the assembly and maintenance of GABAergic synapses in the cerebellar cortex

Affiliations

TrkB (tropomyosin-related kinase B) controls the assembly and maintenance of GABAergic synapses in the cerebellar cortex

Albert I Chen et al. J Neurosci. .

Abstract

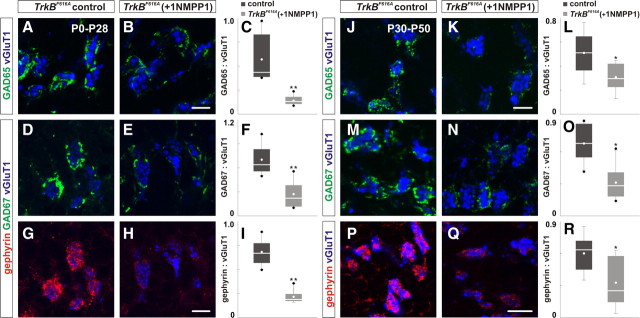
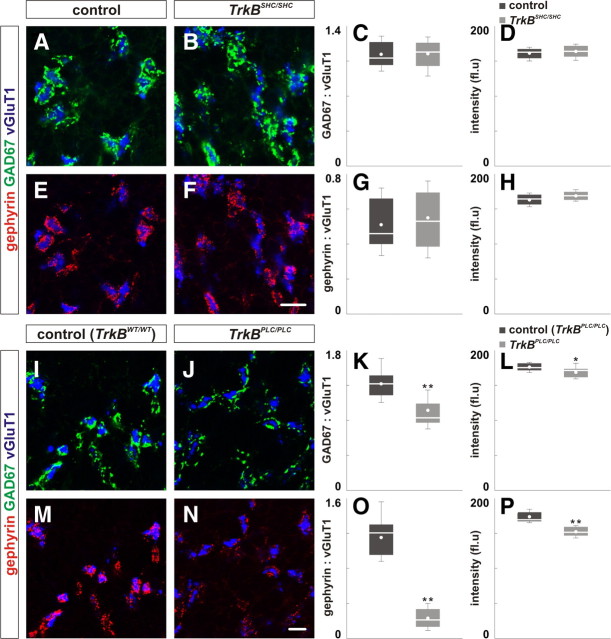
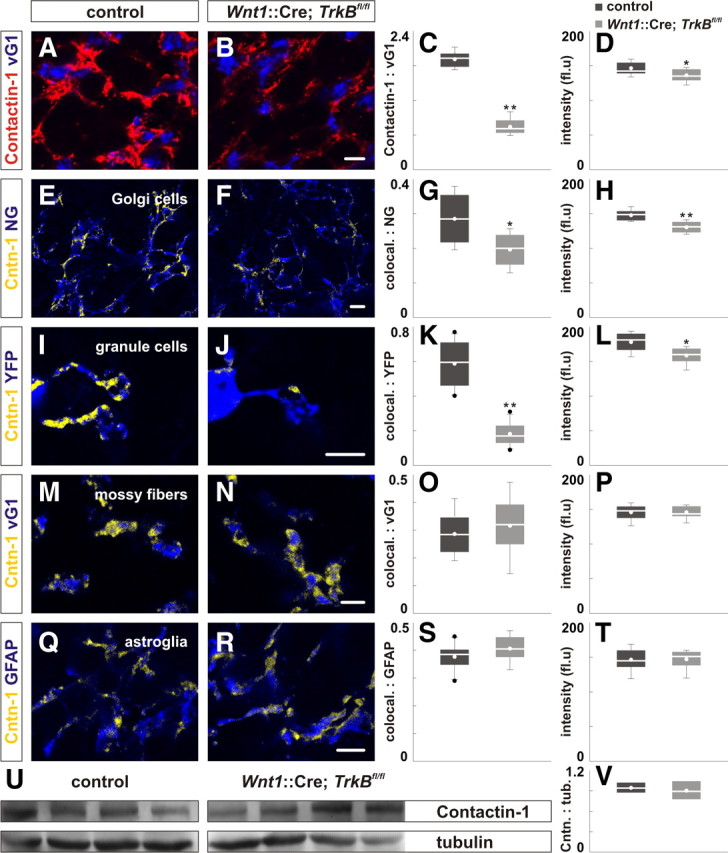
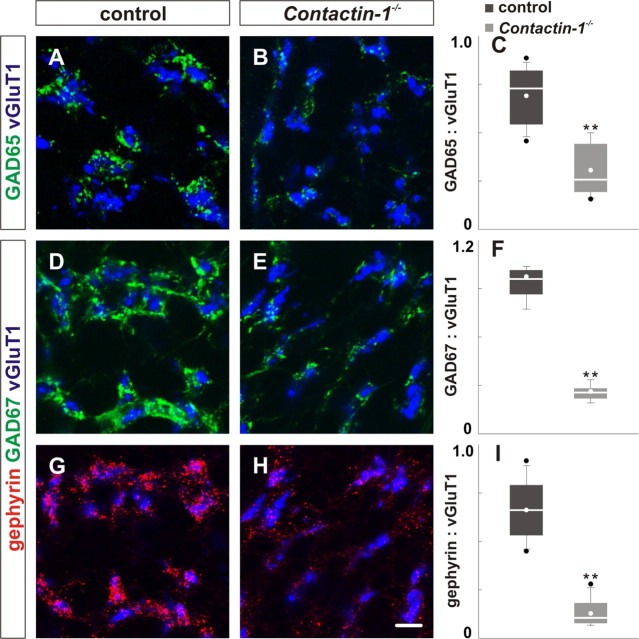
Inhibitory interneurons play a critical role in coordinating the activity of neural circuits. To explore the mechanisms that direct the organization of inhibitory circuits, we analyzed the involvement of tropomyosin-related kinase B (TrkB) in the assembly and maintenance of GABAergic inhibitory synapses between Golgi and granule cells in the mouse cerebellar cortex. We show that TrkB acts directly within each cell-type to regulate synaptic differentiation. TrkB is required not only for assembly, but also maintenance of these synapses and acts, primarily, by regulating the localization of synaptic constituents. Postsynaptically, TrkB controls the localization of a scaffolding protein, gephyrin, but acts at a step subsequent to the localization of a cell adhesion molecule, Neuroligin-2. Importantly, TrkB is required for the localization of an Ig superfamily cell adhesion molecule, Contactin-1, in Golgi and granule cells and the absence of Contactin-1 also results in deficits in inhibitory synaptic development. Thus, our findings demonstrate that TrkB controls the assembly and maintenance of GABAergic synapses and suggest that TrkB functions, in part, through promoting synaptic adhesion.


Figures

Figure 1.
Figure 1.
Organization of GABAergic synaptic proteins in the developing and mature cerebellum. A, Major neuronal subtypes are organized in different lamina in the cerebellar cortex (+, excitatory input; −, inhibitory inputs). Golgi cells (G.c.) (green) provide feedback inhibition to granule cells (gr.c.) (red) in the IGL (Eccles et al., 1967). B, The glomerulus is a complex of synapses in which a mossy fiber ending (blue) forms glutamatergic synapses on the inner surface of the enveloping dendrites of granule cells (Berglund et al., 1999) and the axon termini of Golgi cells (green) form inhibitory synapses on the outer surface of the same dendrites (Jakab and Hámori, 1988). C–E, vGluT1 expression marks mossy fiber endings at P14 (C), P21 (D), and P90 (E). F, G, Quantification of the area of vGluT1 expression (F) expressed as sum of pixels per region analyzed, and the intensity of vGluT1 expression (G) expressed as fluorescent units (fl.u.) from P14–P90. H–J, Gephyrin expression (Berglund et al., 1999), found on granule cell dendrites, surrounds mossy fiber endings (blue) at P14 (H), P21 (I), and P90 (J). K, L, Quantification of the area (K) and intensity (L) of gephyrin expression in the IGL from P14–P90. M–O, GAD65 expression (green) marks Golgi axon varicosities which surrounds mossy fiber endings (blue) at P14 (M), P21 (N), and P90 (O). P, Q, Quantification of the area (P) and intensity (Q) of GAD65 expression. R–T, Golgi axon varicosities surrounding mossy fiber endings (blue) can also be marked by GAD67 expression (green) at P14 (R), P21 (S), and P90 (T). U, V, Quantification of the area (U) and intensity (V) of GAD67 expression. Scale bar, 10 μm. *Box plots contain lower and upper limits (“whiskers”), first and third quartile (edges of the box), median (white bar), mean (white dot), and outliers (black dots) of the dataset. From herein, refer to Tables S1–3 (available at www.jneurosci.org as supplemental material) for mean values and statistics (Mann–Whitney U test and Kruskal-Wallis test).
Figure 2.
Figure 2.
Loss of TrkB in the cerebellum disrupts the localization of GABAergic synaptic proteins. A–F, Loss of TrkB results in reduced localization of GAD67 (green) (B) and vGAT (green) (E) at GABAergic synapses in the IGL of P21 Wnt1::Cre;TrkBfl/fl mice compared with control (A, D). C, F, Quantification of the area ratio of GAD67:vGluT1 expression (C) and vGAT:vGluT1 expression (F) from control and Wnt1::Cre;TrkBfl/fl mice. G–L, Loss of TrkB results in reduced localization of gephyrin (red) (H), but not Neuroligin-2 (NL-2) (red) (K) in the IGL of Wnt1::Cre;TrkBfl/fl mice compared with control (G, J). I, L, Quantification of the area ratio of gephyrin:vGluT1 expression (I) and Neuroligin-2:vGluT1 expression (L) from control and Wnt1::Cre;TrkBfl/fl mice. The area and intensity of vGluT1 expression (blue) were not perturbed in mice lacking TrkB (supplemental Fig. S1, supplemental Table S1B, available at www.jneurosci.org as supplemental material), so vGluT1 expression was used to normalize the number and area of glomeruli per section. Scale bar, 10 μm. M, Immunoblot analysis of the expression level of synaptic proteins in cerebellar lysates from two P21 Wnt1::Cre;TrkBfl/fl mice compared with control. N–Q, Quantification of the intensity of individual bands for GAD65, GAD67 and two gephyrin isoforms (98 and 95 kDa) from control and Wnt1::Cre;TrkBfl/fl mice. N, The level of GAD65 was reduced in Wnt1::Cre;TrkBfl/fl mice (0.23 ± 0.02) compared with control (0.37 ± 0.02; p < 0.01). O, The level of GAD67, however, was not reduced in Wnt1::Cre;TrkBfl/fl mice (0.23 ± 0.02) compared with control (0.21 ± 0.01; p = 0.460). P, Q, Similarly, the level of both gephyrin isoforms was comparable between Wnt1::Cre;TrkBfl/fl mice (98 kDa: 0.56 ± 0.05; 95 kDa: 0.81 ± 0.07) and control (98 kDa: 0.48 ± 0.05, p = 0.222; 95 kDa: 0.76 ± 0.03, p = 0.841). Duplicates from 5 animals were analyzed for each condition.
Figure 3.
Figure 3.
Consequences of the specific deletion of TrkB in Golgi cells or granule cells. A–H, Loss of TrkB in presynaptic Golgi cells resulted in reduced GAD67 localization (green) (B), but did not alter gephyrin localization (red) (F) in the IGL of P21 mGluR2::Cre;TrkBfl/fl mice compared with control (A, E). C, D, G, H, Quantification of the area ratio of GAD67:vGluT1 (C), gephyrin:vGluT1 expression (G) and the intensity of GAD67 (D) and gephyrin expression (H) in control and mGluR2::Cre;TrkBfl/fl mice. I–P, Loss of TrkB in postsynaptic granule cells did not influence GAD67 localization (green) (J), but resulted in reduced gephyrin localization (red) (N) in the IGL of mα6::Cre;TrkBfl/fl mice compared with control (I, M). K, L, O, P, Quantification of the area ratio of GAD67:vGluT1 (K), gephyrin:vGluT1 expression (O) and the intensity of GAD67 (K), gephyrin expression (P) in control and mα6::Cre;TrkBfl/fl mice. Scale bar, 10 μm.
Figure 4.
Figure 4.
Consequences of the deletion of TrkB on synaptic junctions in the cerebellar glomeruli. A, B, Loss of TrkB did not influence the number of excitatory synapses (black arrows) or granule cell plaques (yellow arrows) per glomerulus in P41 Wnt1::Cre;TrkBfl/fl mice (B) compared with control (A) (Ai/Aii and Bi/Bii correspond to dotted box in A and B). However, loss of TrkB resulted in a reduced number of inhibitory synapses per glomerulus and per Golgi cell ending in Wnt1::Cre;TrkBfl/fl mice (red arrows; B) compared with control (A). C–F, Quantification of the number of excitatory synapses (e.s.) (C; control, 6.37 ± 0.46; Wnt1::Cre;TrkBfl/fl, 6.66 ± 0.39; p = 0.863), granule cell plaques (D; control, 2.56 ± 0.15; Wnt1::Cre;TrkBfl/fl, 2.33 ± 0.17; p = 0.386), and inhibitory synapse per glomerulus (i.s.) (E; control, 4.22 ± 0.39; Wnt1::Cre;TrkBfl/fl, 2.33 ± 0.33, p < 0.01) and per Golgi cell ending (F; control, 2.10 ± 0.14; Wnt1::Cre;TrkBfl/fl, 1.20 ± 0.11, p < 0.001). G, H, Loss of TrkB in granule cells did not influence the number of excitatory synapses (black arrows) or granule cell plaques (yellow arrows) per glomerulus in mα6::Cre;TrkBfl/fl mice (H) compared with control (G) (Gi/Gii and Hi/Hii correspond to dotted box in G and H). However, loss of TrkB resulted in reduced number of inhibitory synapses per glomerulus and per Golgi cell ending in mα6::Cre;TrkBfl/fl mice (red arrows; H) compared with control (G). I–L, Quantification of the number of excitatory synapses (e.s.; I; control, 6.77 ± 0.51; Wnt1::Cre;TrkBfl/fl, 6.96 ± 0.49; p = 0.666), granule cell plaques (J; control, 2.37 ± 0.15; Wnt1::Cre;TrkBfl/fl, 2.59 ± 0.16; p = 0.436), and inhibitory synapses per glomerulus (i.e.; K; control, 4.48 ± 0.38; Wnt1::Cre;TrkBfl/fl, 2.56 ± 0.49; p < 0.01) and per Golgi cell ending (L; control, 1.83 ± 0.17, Wnt1::Cre;TrkBfl/fl, 0.93 ± 0.16; p < 0.001). Asterisk denotes Golgi cell ending. Scale bar, 2 μm.
Figure 5.
Figure 5.
Inactivation of TrkB kinase activity disrupts the localization of GABAergic synaptic proteins. A–I, Homozygous mice carrying TrkBF616A allele were treated with water or 1NMPP1 from P0 to P28 and analyzed at P28. The localization of GAD65 (green; B), GAD67 (green; E) and gephyrin (red; H) in the IGL is reduced in TrkBF616A mice treated with 1NMPP1 compared with TrkBF616A mice treated with water (A, D, G). C, F, I, Quantification of the area ratio of GAD65:vGluT1 (C), GAD67:vGluT1 (F) and gephyrin:vGluT1 expression (I) in control and 1NMPP1-treated mice. J–R, Homozygous mice carrying TrkBF616A allele were treated with water or 1NMPP1 from P30 to P50 and analyzed at P50. The localization of GAD65 (green; K), GAD67 (green; N) and gephyrin (red; Q) is reduced in TrkBF616A mice treated with 1NMPP1 compared with control (J, M, P). L, O, R, Quantification of the area ratio of GAD65:vGluT1 (L), GAD67:vGluT1 (O) and gephyrin:vGluT1 expression (R) in control and 1NMPP1-treated mice. Scale bar, 10 μm.
Figure 6.
Figure 6.
Disruption of the PLC-γ1-binding site, but not Shc, perturbs the localization of GABAergic synaptic proteins. A–H, The localization of GAD67 (green; B) and gephyrin (red; F) in the IGL of P21 TrkBSHC/SHC mice was comparable to control mice (A, E). C, D, G, H, Quantification of the area ratio of GAD67:vGluT1 (C), gephyrin:vGluT1 expression (G), and the intensity of GAD67 (D) and gephyrin expression (H) in control and TrkBSHC/SHC mice. I–P, The localization of GAD67 (green; J) and gephyrin (red; N) in the IGL of P21 TrkBPLC/PLC mice is reduced compared with control (I, M). Wild-type TrkB knock-in mice were used as control (TrkBWT/WT) (Minichiello et al., 2002). K, L, O, P, Quantification of the area ratio of GAD67:vGluT1 (K), gephyrin:vGluT1 expression (O) and the intensity of GAD67 (L) and gephyrin expression (P) in control and TrkBPLC/PLC mice. Scale bar, 10 μm.
Figure 7.
Figure 7.
Loss of TrkB in the cerebellum results in reduction of Contactin-1 localization on Golgi and granule cells. A, B, Loss of TrkB results in reduced localization of Contactin-1 in the IGL of P21 Wnt1::Cre;TrkBfl/fl mice (B) compared with control (A). C, D, Quantification of the area ratio of Contactin-1:vGluT1 (C) and the intensity of Contactin-1 expression (D) expression in control and Wnt1::Cre;TrkBfl/fl mice. For E–T, yellow represents only colocalized Contactin-1 on individual markers in blue (see Materials and Methods). E–L, Loss of TrkB results in reduced Contactin-1 localization (yellow) on Neurogranin+ Golgi cell axons (blue) and YFP+ granule cell dendrites (blue) in Wnt1::Cre;TrkBfl/fl; Thy1::YFP mice (F, J) compared with control (E, I). G, H, K, L, Quantification of the area ratio of colocalized Contactin-1:Neurogranin (colocal.:NG) (G), Contactin-1:YFP (colocal.:YFP) (K), and the intensity of colocalized Contactin-1 expression (K, L). M–T, The colocalization of Contactin-1 (yellow) on vGluT+ mossy fibers (blue) and on GFAP+ astroglia is not perturbed in P21 Wnt1::Cre;TrkBfl/fl mice (N, R) compared with control (M, Q). O, P, S, T, Quantification of the area ratio of colocalized Contactin-1:vGluT1 (colocal.:vGluT1) (O), Contactin-1:GFAP (colocal.:GFAP) (S), and the intensity of colocalized Contactin-1 expression (P, T). Scale bar, 10 μm. U, Immunoblot analysis shows that the expression of Contactin-1 was not perturbed in lysates from four P21 Wnt1::Cre;TrkBfl/fl mice compared with control. V, Quantification of the intensity of the band for Contactin-1 (135 kDa) normalized to the intensity of tubulin in control (0.94 ± 0.04) and Wnt1::Cre;TrkBfl/fl lysates (0.90 ± 0.07; p = 0.885).
Figure 8.
Figure 8.
Loss of Contactin-1 leads to a reduction of the localization of presynaptic and postsynaptic GABAergic proteins. A, B, The localization of GAD65 (green) in the IGL is reduced in P18 Contactin-1−/− mice (B) compared with control (A). C, Quantification of the area ratio of GAD65:vGluT1 expression in control and Contactin-1−/− mice. D, E, Similarly, the localization of GAD67 (green) in the IGL of is reduced in P18 Contactin-1−/− mice (E) compared with control (D). F, Quantification of the area ratio of GAD67:vGluT1 expression in control and Contactin-1−/− mice. G, H, The localization of gephyrin (Berglund et al., 1999) in the IGL is also reduced in P18 Contactin-1−/− mice (H) compared with control (G). I, Quantification of the area ratio of gephyrin:vGluT1 expression in control and Contactin-1−/− mice. Scale bar, 10 μm.

Similar articles

Cited by

References

    1. Altman J, Bayer SA. Development of the cerebellar system: in relation to its evolution, structure, and functions. Boca Raton, FL: CRC; 1997.
    1. Ango F, di Cristo G, Higashiyama H, Bennett V, Wu P, Huang ZJ. Ankyrin-based subcellular gradient of neurofascin, an immunoglobulin family protein, directs GABAergic innervation at Purkinje axon initial segment. Cell. 2004;119:257–272. - PubMed
    1. Bao S, Chen L, Qiao X, Thompson RF. Transgenic brain-derived neurotrophic factor modulates a developing cerebellar inhibitory synapse. Learn Mem. 1999;6:276–283. - PMC - PubMed
    1. Berglund EO, Ranscht B. Molecular cloning and in situ localization of the human contactin gene (CNTN1) on chromosome 12q11–q12. Genomics. 1994;21:571–582. - PubMed
    1. Berglund EO, Murai KK, Fredette B, Sekerková G, Marturano B, Weber L, Mugnaini E, Ranscht B. Ataxia and abnormal cerebellar microorganization in mice with ablated contactin gene expression. Neuron. 1999;24:739–750. - PubMed

Publication types

MeSH terms