. 2011 Feb 23;31(8):2815-27.
doi: 10.1523/JNEUROSCI.2475-10.2011.

Glycine receptor channels in spinal motoneurons are abnormal in a transgenic mouse model of amyotrophic lateral sclerosis

Affiliations

Glycine receptor channels in spinal motoneurons are abnormal in a transgenic mouse model of amyotrophic lateral sclerosis

Qing Chang et al. J Neurosci. .

Abstract

Amyotrophic lateral sclerosis (ALS) is a rapidly evolving and fatal adult-onset neurological disease characterized by progressive degeneration of motoneurons. Our previous study showed that glycinergic innervation of spinal motoneurons is deficient in an ALS mouse model expressing a mutant form of human superoxide dismutase-1 with a Gly93→Ala substitution (G93A-SOD1). In this study, we have examined, using whole-cell patch-clamp recordings, glycine receptor (GlyR)-mediated currents in spinal motoneurons from these transgenic mice. We developed a dissociated spinal cord culture model using embryonic transgenic mice expressing enhanced green fluorescent protein (eGFP) driven by the Hb9 promoter. Motoneurons were identified as Hb9-eGFP-expressing (Hb9-eGFP(+)) neurons with a characteristic morphology. To examine GlyRs in ALS motoneurons, we bred G93A-SOD1 mice to Hb9-eGFP mice and compared glycine-evoked currents in cultured Hb9-eGFP(+) motoneurons prepared from G93A-SOD1 embryos and from their nontransgenic littermates. Glycine-evoked current density was significantly smaller in the G93A-SOD1 motoneurons compared with control. Furthermore, the averaged current densities of spontaneous glycinergic miniature IPSCs (mIPSCs) were significantly smaller in the G93A-SOD1 motoneurons than in control motoneurons. No significant differences in GABA-induced currents and GABAergic mIPSCs were observed between G93A-SOD1 and control motoneurons. Quantitative single-cell reverse transcription-PCR found lower GlyRα1 subunit mRNA expression in G93A-SOD1 motoneurons, indicating that the reduction of GlyR current may result from the downregulation of GlyR mRNA expression in motoneurons. Immunocytochemistry demonstrated a decrease of surface postsynaptic GlyR on G93A-SOD1 motoneurons. Our study suggests that selective alterations in GlyR function contribute to inhibitory insufficiency in motoneurons early in the disease process of ALS.


Figures

Figure 1.
Figure 1.
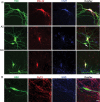
Hb9–eGFP-positive neurons in spinal cord sections of embryonic, early postnatal, and adult Hb9–eGFP transgenic mice. A, In E13, postnatal day 1 (P1), and adult Hb9–eGFP transgenic mice, low-power fluorescent micrographs illustrate the distribution of eGFP+ neurons in the spinal cord. B, Higher-magnification images show large-sized, but not small-sized (arrow), Hb9–eGFP+ neurons colabeled (yellow) with the motoneuron marker ChAT (red). C, A representative confocal image showing an Hb9–eGFP+ motoneuron in a ventral lumbar spinal cord section from an adult Hb9–eGFP mouse contacted with GlyT2 (red) and GAD (blue) boutons. D, E, In medial lamina VIII, intermediomedical cell column, and lamina X of adult Hb9–eGFP mice, subsets of small Hb9–eGFP+ interneurons (arrows) are neither calbindin+ (Cal; D, red) nor ChAT+ (E, red). CC, Central canal; VH, ventral horn. Scale bars: A, D, E, 100 μm; B, C, 20 μm.
Figure 2.
Figure 2.
Identification of motoneurons in Hb9–eGFP mouse spinal cord cultures. A, Hb9–eGFP+ neurons in DIV 12–16 dissociated spinal cord cultures colabeled (see Overlay) with SMI-32 (red) and ChAT (blue). Large eGFP+ cells (Ai, Aii) that are double labeled with SMI-32 and ChAT immunoreactivities, as well as small eGFP+ cells (Aii, arrow) that are mostly SMI-32/ChAT are shown. Medium-sized eGFP+ cells (Aiii) with characteristic morphologies that mimic the large Hb9 motoneurons are also SMI-32+/ChAT+. B, Hb9–eGFP+ spinal motoneurons are contacted with presynaptic glycinergic GlyT2 (red) and GABAergic GAD (blue) boutons. Scale bars, 20 μm.
Figure 3.
Figure 3.
Glycine-induced currents are decreased in G93A–SOD1 motoneurons. A, An Hb9–eGFP+ motoneuron is identified under fluorescent microscope and recorded under DIC optics, along with a patch electrode (right) and a drug application pipette (left) containing 1 mm glycine. Scale bar, 20 μm. B, A 100 ms pulse (2–3 psi) of glycine (1 mm) evokes an inhibitory current that is blocked by strychnine (Stry; 1 μm). C, Representative recordings of glycine-evoked currents in control and G93A–SOD1 motoneurons. D, Glycine current densities in G93A–SOD1 motoneurons (n = 17) are significantly smaller than in controls (n = 20). Data represent the mean ± SEM (**p < 0.01, Student's t test). E, Examples of traces of glycine-evoked currents at the holding potentials indicated next to each trace and their I–V plots in control and G93A–SOD1 motoneurons. The peak amplitude of glycine currents at different holding potentials in G93A–SOD1 motoneurons are smaller than in control motoneurons, whereas no difference is observed in the reversal potential of glycine currents between G93A–SOD1 and control motoneurons.
Figure 4.
Figure 4.
Glycinergic mIPSCs are altered in G93A–SOD1 motoneurons. A, Glycinergic mIPSCs are detected in Hb9–eGFP motoneurons in the presence of TTX (0.5 μm), CNQX (5 μm), APV (50 μm), and bicuculline (Bic; 5 μm). Strychnine (Stry; 1 μm) blocks all the events that remain after application of the inhibitor mixture. B, C, Glycinergic mIPSCs in control and G93A–SOD1 motoneurons. Representative traces of mIPSCs, averaged mIPSC events (B), and the amplitude distributions/cumulative fraction histograms of mIPSCs (C) are shown for a given recording. Note the increase in the number of low-amplitude events in the G93A–SOD1 motoneurons (for group averages, see Results). Holding potential, −65 mV.
Figure 5.
Figure 5.
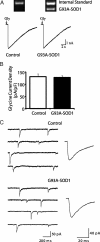
Glycine receptor-mediated currents are rescued in G93A–SOD1 motoneurons in chimeric culture. A, Top, Single-cell genotyping of a non-mutant SOD1/Hb9–eGFP motoneuron and a G93A–SOD1/Hb9–eGFP motoneuron from the same culture. Bottom, Glycine-evoked currents in these two motoneurons. B, No significant differences in glycine-induced current densities are observed between G93A–SOD1 (n = 8) and control motoneurons (n = 7). Data represent the mean ± SEM (Student's t test). C, Representative traces and averaged glycinergic mIPSCs events in a control motoneuron and a G93A–SOD1 motoneuron.
Figure 6.
Figure 6.
GABAA receptor-mediated currents are not affected in G93A–SOD1 motoneurons. A, A 100 ms pulse (2–3 psi) of GABA (100 μm) evokes an inhibitory current that is blocked by bicuculline (Bic; 50 μm). B, Sample recordings of GABA-evoked currents in control and G93A–SOD1 motoneurons. C, No significant differences in GABA-induced current densities are observed between control (n = 30) and G93A–SOD1 (n = 24) motoneurons. Data represent the mean ± SEM (Student's t test). D, GABAergic mIPSCs are detected in Hb9–eGFP motoneurons in the presence of TTX (0.5 μm), CNQX (5 μm), APV (50 μm), and strychnine (Stry; 0.5 μm). Bicuculline (Bic; 50 μm) blocks all the events that remain after application of the inhibitor mixture. E, Representative traces and averaged GABAergic mIPSCs events in a control motoneuron and a G93A–SOD1 motoneuron.
Figure 7.
Figure 7.
GlyR α1 subunit mRNA expression is decreased in G93A–SOD1 motoneurons. A, A validation experiment showing Ct values for GlyRα1 (squares) and β-actin (triangles) plotted against total spinal cord mRNA concentration. The amplification efficiencies (E) of the GlyRα1 and β-actin are similar. B, Representative real-time PCR amplification plots of GlyRα1 (squares) and β-actin (triangles) transcripts expression in a control and a G93A–SOD1 motoneuron. Ct for each transcript is shown as the intersection of the bold line with the RFU (relative fluorescence units) plot. C, Quantitative real-time RT-PCR analysis of GlyRα1 gene expression levels in control and G93A–SOD1 Hb9–eGFP motoneurons. Expression levels of GlyRα1 mRNA were calculated using the ΔΔCt method ΔΔCt = ΔCt,Sample − ΔCt,Calibrator, where the calibrator is 0.5 pg of total spinal cord mRNA, which was subjected to the same RT-PCR as the samples on each plate. Data are mean ± SEM; n = 15–28. **p < 0.01. D, Quantitative real-time RT-PCR analysis of GlyRα1 gene expression levels in small bipolar Hb9–eGFP interneurons in control and G93A–SOD1 cultures. Data are mean ± SEM; n = 6–8. The inset shows a representative fluorescent micrograph of a small bipolar Hb9–eGFP interneuron used for the single-cell RT-PCR. Scale bar, 10 μm.
Figure 8.
Figure 8.
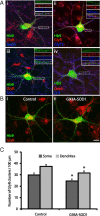
Surface GlyR expression is decreased in G93A–SOD1 motoneurons. A, Confocal images show the localization of GlyRs (Ai–Aiii, red) in close apposition to postsynaptic scaffold protein gephyrin (Geph; Ai, blue), presynaptic GlyT2 (Aii, blue), and presynaptic synaptophysin (SYN; Aiii, blue) immunoreactivities on the surface of the soma and proximal dendrites of Hb9–eGFP motoneurons. Coincidence of Geph (red) and SYN (blue) immunoreactivities on Hb9–eGFP motoneurons is also shown (Aiv). B, Representative images showing the localization of GlyRs (red) on Hb9–eGFP motoneurons from control (Bi) and G93A–SOD1 (Bii) cultures. C, Quantitative analysis of GlyR densities on the surface of soma and proximal dendrites in control motoneurons (n = 47) and G93A–SOD1 motoneurons (n = 42). Data represent the mean ± SEM (*p < 0.05, Student's t test). Scale bar, 20 μm.

References

    1. Arber S, Han B, Mendelsohn M, Smith M, Jessell TM, Sockanathan S. Requirement for the homeobox gene Hb9 in the consolidation of motor neuron identity. Neuron. 1999;23:659–674. - PubMed
    1. Avossa D, Grandolfo M, Mazzarol F, Zatta M, Ballerini L. Early signs of motoneuron vulnerability in a disease model system: characterization of transverse slice cultures of spinal cord isolated from embryonic ALS mice. Neuroscience. 2006;138:1179–1194. - PubMed
    1. Beato M. The time course of transmitter at glycinergic synapses onto motoneurons. J Neurosci. 2008;28:7412–7425. - PMC - PubMed
    1. Betz H, Kuhse J, Fischer M, Schmieden V, Laube B, Kuryatov A, Langosch D, Meyer G, Bormann J, Rundström N, Matzenbach B, Kirsch J, Ramming M. Structure, diversity and synaptic localization of inhibitory glycine receptors. J Physiol Paris. 1994;88:243–248. - PubMed
    1. Bories C, Amendola J, Lamotte d'Incamps B, Durand J. Early electrophysiological abnormalities in lumbar motoneurons in a transgenic mouse model of amyotrophic lateral sclerosis. Eur J Neurosci. 2007;25:451–459. - PubMed

Publication types

MeSH terms