. 2011 Feb 23;31(8):2843-54.
doi: 10.1523/JNEUROSCI.4869-10.2011.

Theta phase precession in rat ventral striatum links place and reward information

Affiliations

Theta phase precession in rat ventral striatum links place and reward information

Matthijs A A van der Meer et al. J Neurosci. .

Abstract

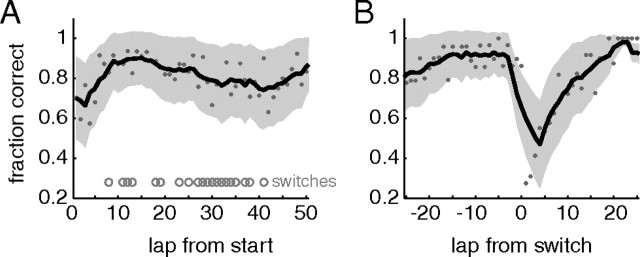
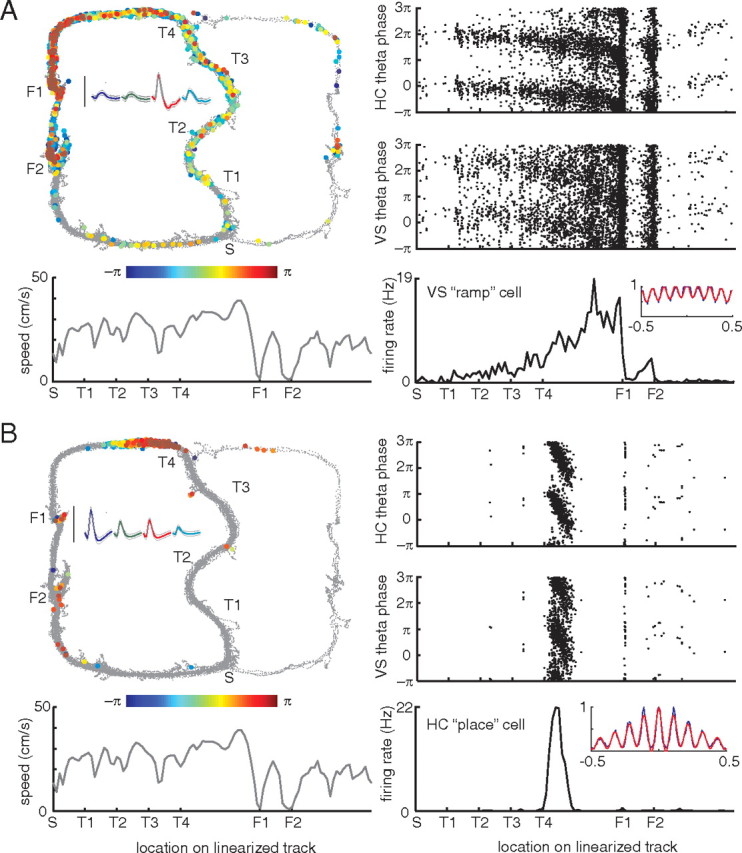
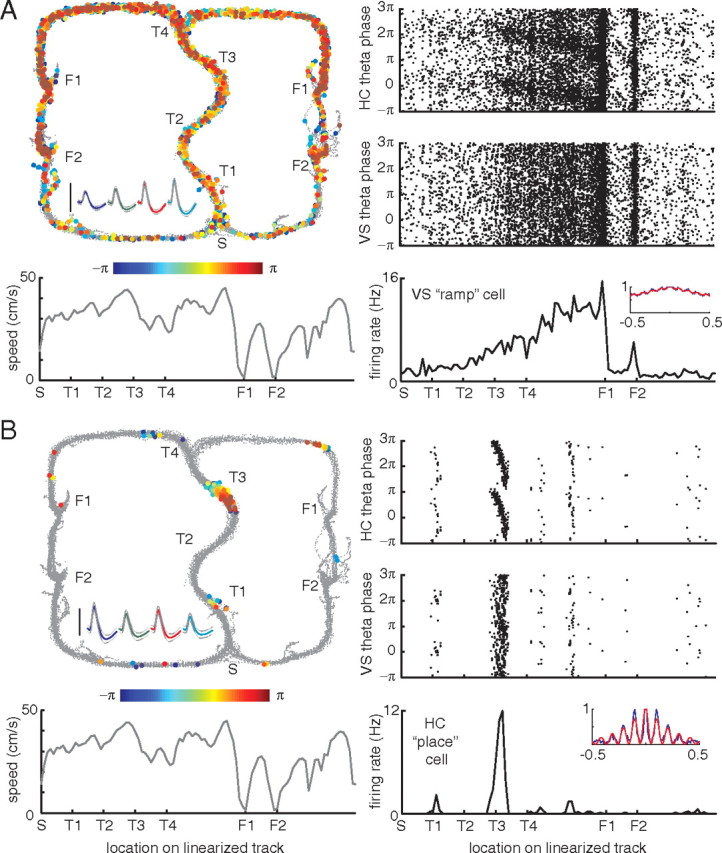
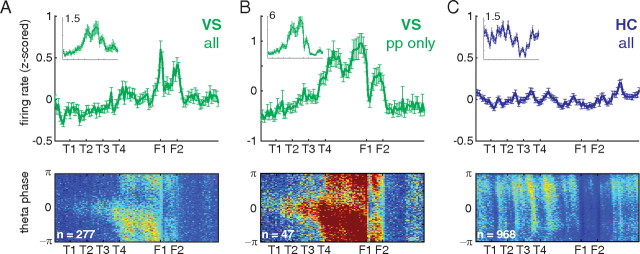
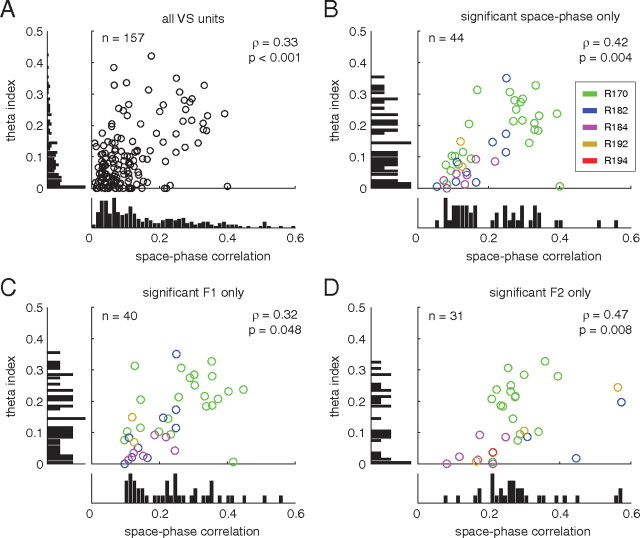
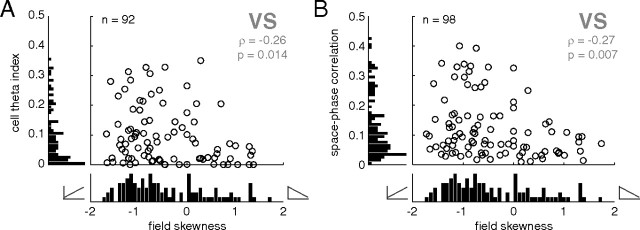
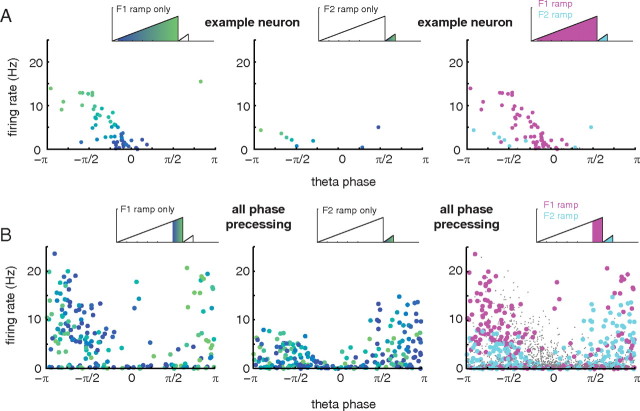
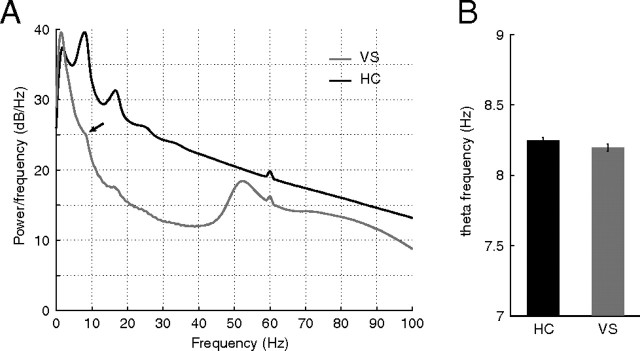
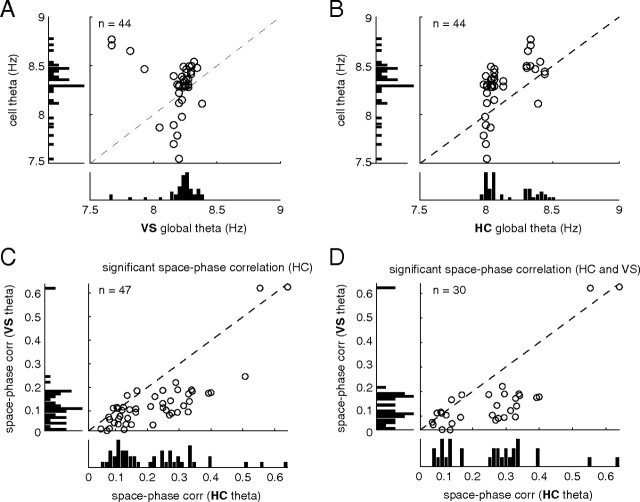
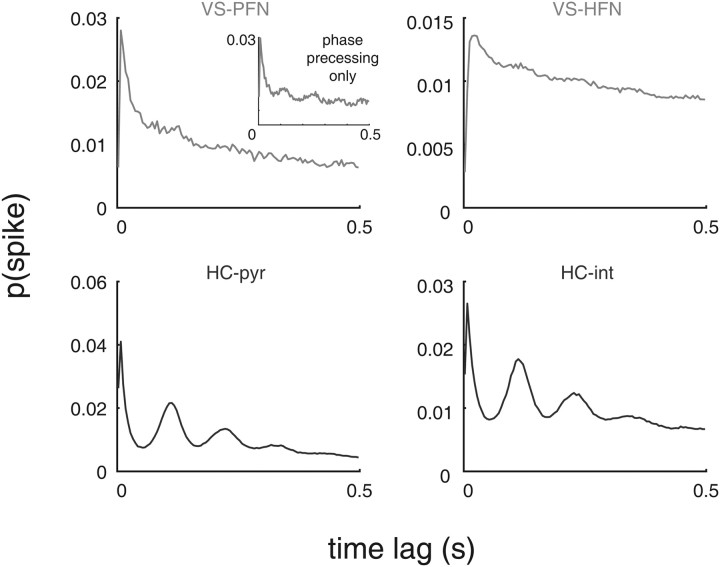
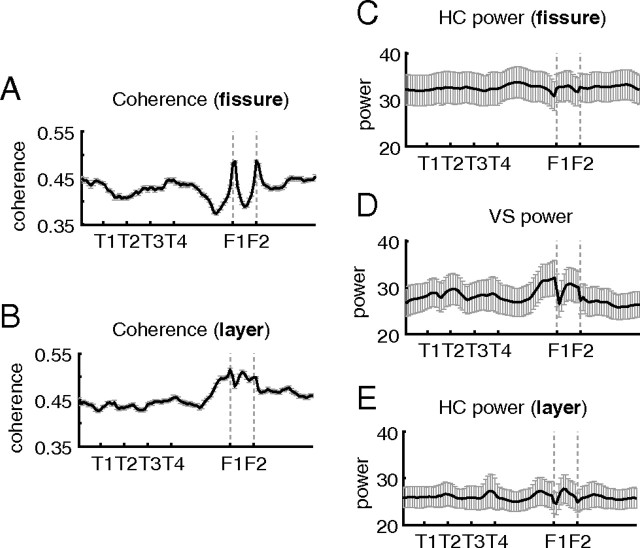
A functional interaction between the hippocampal formation and the ventral striatum is thought to contribute to the learning and expression of associations between places and rewards. However, the mechanism of how such associations may be learned and used is currently unknown. We recorded neural ensembles and local field potentials from the ventral striatum and CA1 simultaneously as rats ran a modified T-maze. Theta-modulated cells in ventral striatum almost invariably showed firing phase precession relative to the hippocampal theta rhythm. Across the population of ventral striatal cells, phase precession was preferentially associated with an anticipatory ramping of activity up to the reward sites. In contrast, CA1 population activity and phase precession were distributed more uniformly. Ventral striatal phase precession was stronger to hippocampal than ventral striatal theta and was accompanied by increased theta coherence with hippocampus, suggesting that this effect is hippocampally derived. These results suggest that the firing phase of ventral striatal neurons contains motivationally relevant information and that phase precession serves to bind hippocampal place representations to ventral striatal representations of reward.


Figures

Figure 1.
Figure 1.
Behavioral performance. Rats rapidly learned to choose the correct (rewarded) side both from session start (A) and after a contingency switch approximately midway through switch sessions (B). Gray dots indicate the proportion of correct choices at each lap; the black line is the five-lap running average, with the shaded area SEM over subjects. In the left, laps at which a switch occurred are indicated by the gray circles. Left, right, and alternate sessions were averaged together.
Figure 2.
Figure 2.
Recording locations. Thick lines indicate estimated recording areas based on distance from final recording locations identified histologically (bottom of thin lines). Colors correspond to different subjects. All subjects were implanted in the right hemisphere; coordinates are relative to bregma. Example cresyl-violet-stained brain sections shown from one subject (R192); final electrode locations can be seen from the small round electrolysis marks (white arrows). Ventral striatal recording locations were all estimated to be from the nucleus accumbens core and shell; although some electrodes passed through the anterior commissure, this tended to be clearly apparent as a quiet area for recording, and electrodes were rapidly advanced until neuronal activity was reacquired. Figure based on Paxinos and Watson (1998).
Figure 3.
Figure 3.
Examples of theta phase precession in a simultaneously recorded ramp cell in ventral striatum (A) and a place cell in CA1 (B). Top left, Each spike is plotted at the location on the track where it occurred and color coded for theta phase. Notice how as the animal progresses through the turn sequence (T1–T4) and approaches the first reward site (F1) spike theta phase precesses. Inset shows average waveforms for this unit, with the calibration bar indicating 100 μV. Top right, A different view of the phase precession effect, plotting the location of each spike on the same, linearized track against its theta phase. Note the banana-like precession toward the reward sites. For comparison, the same plot is shown with phase calculated relative to ventral striatal, rather than hippocampal, theta. In this case, the precession effect is still visible but noticeably weaker. Bottom left, Average speed on the linearized track. Notice how there is no obvious relationship between speed and phase or speed and firing rate. Bottom right, Average firing rate on the linearized track; notice the large ramp up to the first reward site (F1) and a smaller ramp up to F2. Inset shows the autocorrelogram of this unit (blue line) and its best fit (red line) used for calculating a theta modulation index (see Materials and Methods). Taken from session R170-2009-08-12, tetrode 3 cell 2 (A) and tetrode 9 cell 8 (B).
Figure 4.
Figure 4.
Examples of theta phase precession in a simultaneously recorded ventral striatal ramp cell and a hippocampal place cell from a different subject, R184-2009-09-12, tetrode 1 cell 5 (A) and tetrode 6 cell 7 (B). Figure layout as in Figure 3.
Figure 5.
Figure 5.
Population differences in firing rate and phase precession between simultaneously recorded ventral striatal and hippocampal neurons. Top row, Average z-scored firing rate over the linearized track for all ventral striatal units (A), ventral striatal units with a significant correlation between location on the track and theta firing phase (p < 0.05 uncorrected; B), and all hippocampal CA1 units (C). pp, Phase precession. z-scores were obtained for each unit individually by subtracting the mean firing rate (over locations) and dividing by the SD (over locations) and then averaging. Raw average firing rates are shown in the insets; the label indicates firing rate in hertz. Error bars are SEM over units. Bottom row, Average firing rate histograms by position on the track and theta firing phase. For each unit, these were constructed by dividing the two-dimensional spike count histogram by time spent in each bin and then averaged. Color scale is the same in all three histograms (blue to red, 0 to 0.12 Hz).
Figure 6.
Figure 6.
Theta modulation in ventral striatal units is positively correlated with space–phase correlation, a measure of phase precession strength. Plots show the marginal and joint distributions of the theta index (a measure of theta modulation obtained from multivariate fits to the autocorrelogram) and space–phase correlation. These two quantities were positively correlated regardless of whether all units (A), units that phase precessed anywhere on the track (B), or units that only precessed up to the first (C) or second (D; F1 and F2, respectively) reward site were considered.
Figure 7.
Figure 7.
Ventral striatal units with a firing rate ramp up to the first reward site were preferentially theta modulated and phase precessing. To quantify the degree of “rampiness,” the skewness of firing rate over space was used; negative numbers indicate an upward-sloping ramp as animals approach the reward site, and positive skewness indicates a downward-sloping ramp. To identify ramp cell candidates, only data points for which the spatial tuning curve was well fit by linear regression (p < 0.05) are shown; note that this criterion does not contain a bias in the upward- or downward-sloping direction. Nevertheless, the population of ventral striatal units was biased in the negative skewness/upward-ramping direction (A, B). Upward ramping was associated with higher theta modulation and stronger phase precession.
Figure 8.
Figure 8.
Relationship between firing rate and theta phase in ventral striatal ramp neurons. A, Phase/rate scatter plots for the example neuron in Figure 3. Each data point in the plots corresponds to one bin in the tuning curve of the neuron over the (linearized) track. Left, Phase/rate scatter plot for the firing rate ramp up to the first reward site (F1); the color of each dot corresponds to position along the ramp. Note the clear phase precession (from 0 to approximately −π radians) as the reward site is approached (color change from blue to green). Middle, Phase/rate scatter plot for the firing rate ramp up to the second reward site (F2). Note the much shorter, but clearly visible, sequence of phase precessing data points in the bottom left of the plot. Right, The F1 and F2 firing rate ramps occupy a distinct area of the phase/rate plot: the same theta phase (e.g., −π/2) is associated with different firing rates for two ramps. This can also be seen in the example phase plot in Figure 3, top right. B, This pattern held across all phase precessing neurons (n = 47). For clarity, only spatial bins for which theta firing phase could be estimated with 95% confidence intervals equal to or smaller than π/4 were included in both plots, and the range of spatial locations included was matched for the F1 and F2 ramps; see the schematics above each scatter plot for included regions.
Figure 9.
Figure 9.
Comparison of ventral striatal and hippocampal local field potential properties. A, Average PSD for HC (recorded from the fissure) and VS. Note the prominent theta peak and harmonics in the hippocampal PSD compared with a barely noticeable “shoulder” in the ventral striatal data. Ventral striatum contained clear low (50 Hz) and high (70–100 Hz) gamma power (in line with van der Meer et al., 2010b) absent from the hippocampal fissure. B, Average theta frequency was not different between the two structures.
Figure 10.
Figure 10.
Comparison of phase precession relative to ventral striatal and hippocampal theta signals. Units with a significant space–phase correlation (“phase precessing units”) had a faster theta modulation in their spiking compared with the frequency of both the ventral striatal (A) and hippocampal (B) reference signal. Phase precession strength tended to be stronger relative to the hippocampal, compared with ventral striatal, reference signal (C), this was true even when only cells that phase precessed to both the hippocampal and ventral striatal theta rhythm were considered (D).
Figure 11.
Figure 11.
Relatively weak theta modulation in ventral striatal spiking. Shown are the average autocorrelograms for phasically firing neurons (PFN) (putative medium spiny neurons) and high-firing neurons (HFN) (putative fast-spiking interneurons) in VS (top row) and for putative hippocampal pyramidal neurons (pyr) and interneurons (int; HC, bottom row). Note how the clear theta modulation in the hippocampal neurons is nearly absent from the ventral striatal population. Even if only phase precessing ventral striatal neurons are considered (top left, inset), theta modulation is noticeably weaker than that in hippocampal neurons. Autocorrelograms were constructed by counting the number of spike pairs at a given time lag (in 5 ms bins) and normalizing by the total number of counts in the 500 ms window shown.
Figure 12.
Figure 12.
Theta band coherence between hippocampus and ventral striatum ramped up to the reward sites, both when coherence was computed relative to the hippocampal fissure electrode (A) or an electrode in or near the CA1 cell layer (B). For comparison, the spatial distributions of theta band power are also shown for each recording location separately (C–E).

Similar articles

Cited by

References

    1. Adhikari A, Topiwala MA, Gordon JA. Synchronized activity between the ventral hippocampus and the medial prefrontal cortex during anxiety. Neuron. 2010;65:257–269. - PMC - PubMed
    1. Atallah HE, Lopez-Paniagua D, Rudy JW, O'Reilly RC. Separate neural substrates for skill learning and performance in the ventral and dorsal striatum. Nat Neurosci. 2007;10:126–131. - PubMed
    1. Bast T, Feldon J. Hippocampal modulation of sensorimotor processes. Prog Neurobiol. 2003;70:319–345. - PubMed
    1. Benchenane K, Peyrache A, Khamassi M, Tierney PL, Gioanni Y, Battaglia FP, Wiener SI. Coherent theta oscillations and reorganization of spike timing in the hippocampal-prefrontal network upon learning. Neuron. 2010;66:921–936. - PubMed
    1. Berke JD, Okatan M, Skurski J, Eichenbaum HB. Oscillatory entrainment of striatal neurons in freely moving rats. Neuron. 2004;43:883–896. - PubMed

Publication types

LinkOut - more resources