Comparative Study
. 2011 Feb 23;31(8):2965-73.
doi: 10.1523/JNEUROSCI.4920-10.2011.

Altered neural responses to sounds in primate primary auditory cortex during slow-wave sleep

Affiliations
Comparative Study

Altered neural responses to sounds in primate primary auditory cortex during slow-wave sleep

Elias B Issa et al. J Neurosci. .

Abstract

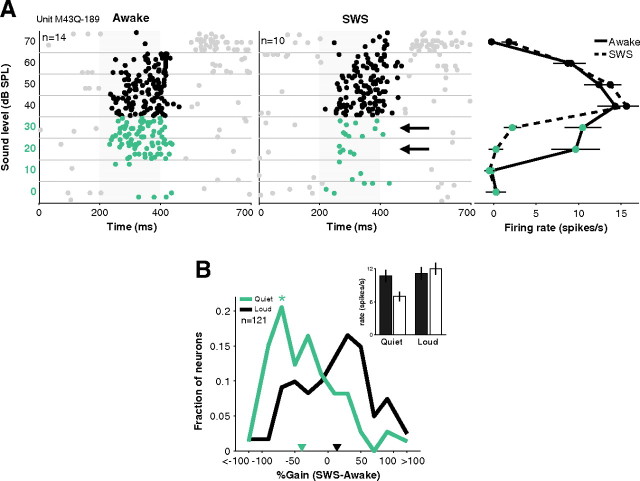
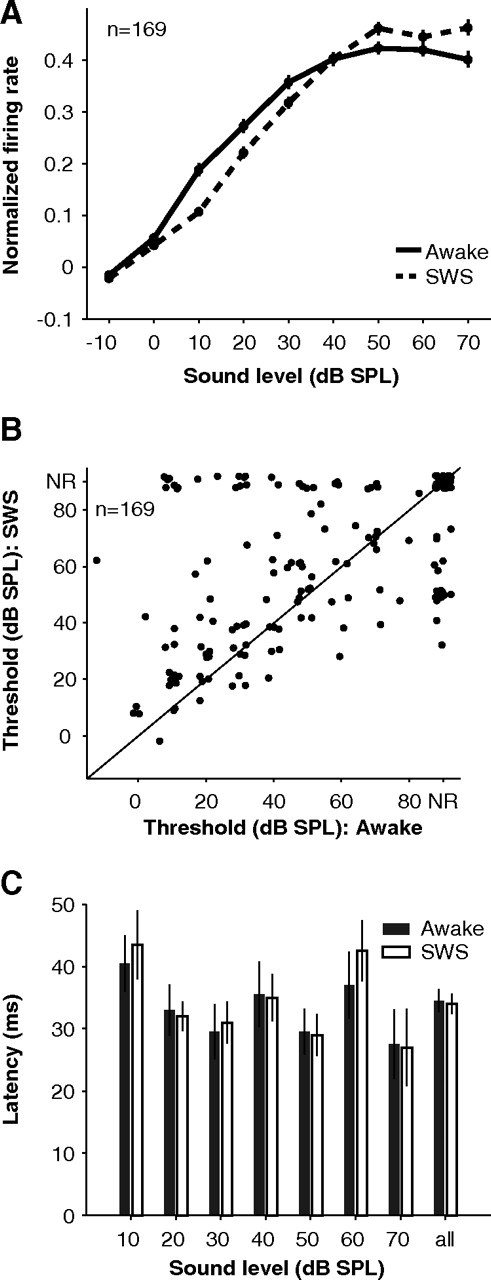
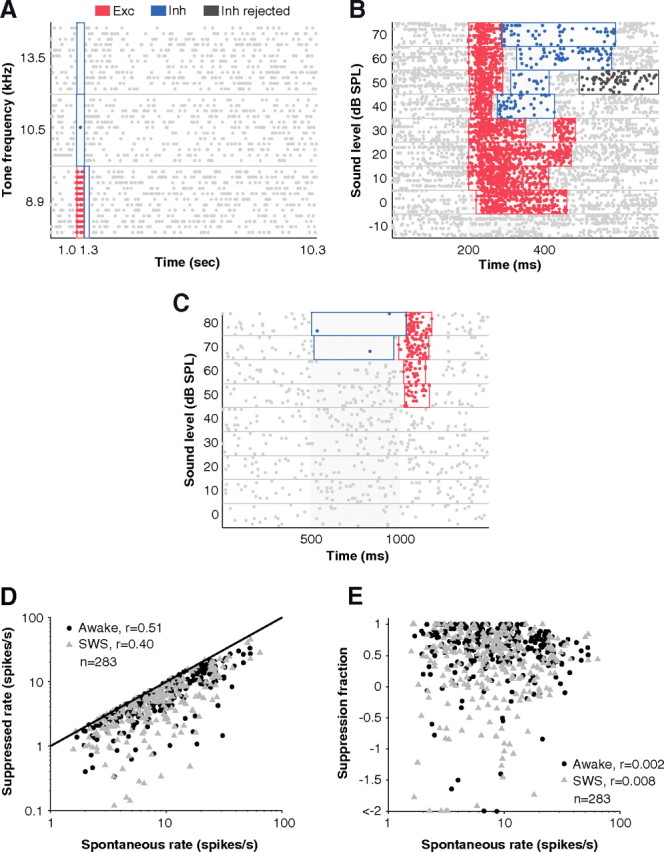
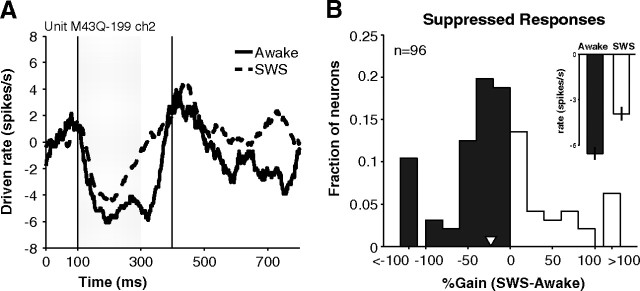
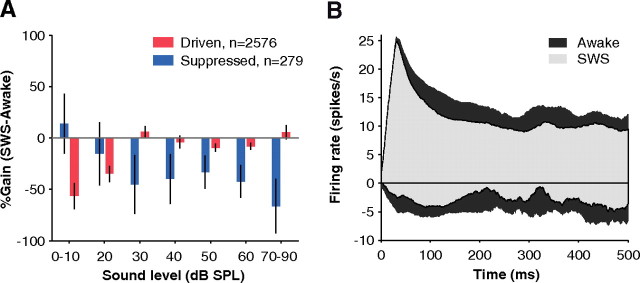
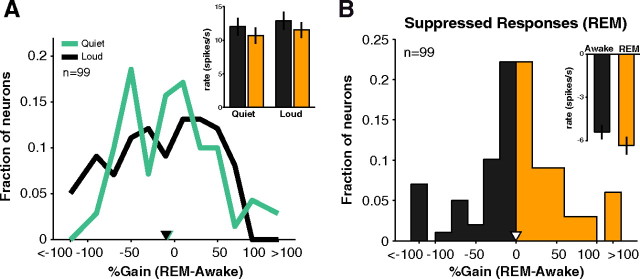
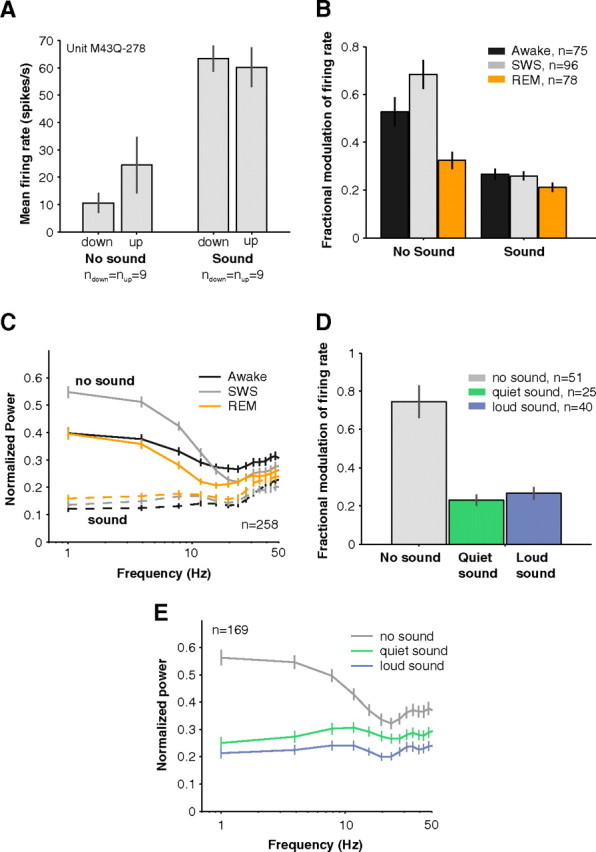
How sounds are processed by the brain during sleep is an important question for understanding how we perceive the sensory environment in this unique behavioral state. While human behavioral data have indicated selective impairments of sound processing during sleep, brain imaging and neurophysiology studies have reported that overall neural activity in auditory cortex during sleep is surprisingly similar to that during wakefulness. This responsiveness to external stimuli leaves open the question of how neural responses during sleep differ, if at all, from wakefulness. Using extracellular neural recordings in the primary auditory cortex of naturally sleeping common marmosets, we show that slow-wave sleep (SWS) alters neural responses in the primate auditory cortex in two specific ways. SWS reduced the sensitivity of auditory cortex such that quiet sounds elicited weak responses in SWS compared with wakefulness, while loud sounds evoked similar responses in SWS and wakefulness. Furthermore, SWS reduced the extent of sound-evoked response suppression. This pattern of alterations was not observed during rapid eye movement sleep and could not be easily explained by the presence of slow rhythms in SWS. The alteration of excitatory and inhibitory responses during SWS suggests limitations in auditory processing and provides novel insights for understanding why certain sounds are processed while others are missed during deep sleep.


Figures

Figure 1.
Figure 1.
Selective loss of responses to quiet sounds during SWS. A, Example neuron whose response to quiet sounds (left, green highlight) disappeared in SWS (black arrows, middle) even though a robust response to loud sounds remained. This neuron responded to both quiet and loud sounds because of its non-monotonic tuning (right) that is often observed in A1. Stimulus was a 780 Hz pure tone. Error bars represent ±1 SEM. B, Across the population of recorded neurons, SWS modulation of responses was not different from zero for 70–90 dB sounds (median = 2%, black inverted triangle). But responses were negatively modulated during SWS at the low end (0–20 dB) of their sound level tuning curve (median = −32%, green inverted triangle; *p < 0.01). Inset, Overall mean firing rates awake (filled bars) and SWS (open bars) to quiet (left) and loud (right) sounds in A1. Error bars represent ±1 SEM.
Figure 2.
Figure 2.
Acoustic thresholds and latencies during SWS. A, Population intensity tuning data in awake (solid) and SWS (dashed). Error bars represent ± 0.5 SEM. Individual tuning curves for each neuron were first normalized by their peak value in either awake or SWS before being averaged. B, Elevated sound level thresholds in SWS compared with wakefulness (p = 0.01, Wilcoxon rank sum, n = 169; NR, not responsive according to a 4*SEM criterion and assigned a threshold of 90 dB SPL). C, Response latencies in SWS (open bars) were similar to those in wakefulness (filled bars) across all sound levels tested (median latency awake = 34.5 + 1.9 vs SWS = 34.0 + 1.7 ms, p = 0.71, Wilcoxon rank sum, n = 244, “all” condition).
Figure 3.
Figure 3.
Detection of suppressed events and dependence on spontaneous rate. A, Well defined periods of excitation (Exc; red) and inhibition (Inh; blue) were detected among a background of high spontaneous firing by the windowing algorithm (see Materials and Methods). No false windows were detected in the 9-s-long period of spontaneous firing following the stimulus. B, The varying durations of excitatory responses were well captured by the algorithm. At higher sound levels, excitation was shorter in duration and was followed by inhibition. In some cases, an inhibitory window was detected by the algorithm but then thrown out (dark gray) because it did not pass a post hoc permutation test for the means when compared with spontaneous firing. C, An example where inhibition preceded excitation at high sound levels. Note that windows were non-overlapping even though excitatory and inhibitory algorithms were run independently. D, Suppressed rates which were already spontaneous-rate subtracted were still highly correlated with spontaneous rates (r = 0.45, p < 0.01, Pearson's correlation coefficient, n = 566), suggesting a scaling relationship between spontaneous rate and suppression. At higher spontaneous rates, higher suppression can be observed extracellularly. This was not a ceiling effect where spontaneous rates limited the amount of suppression that could be observed extracellularly since in most cases firing rates were not suppressed to 0 (i.e., suppression = spontaneous; unity line). E, For the analyses of Figures 4B and 6B in Results, suppressed rates were normalized by spontaneous rate to obtain the fraction of spontaneous rate that was suppressed. This measure removed correlation with spontaneous rate (r = 0.002, p = 0.26, Pearson's correlation coefficient, n = 566).
Figure 4.
Figure 4.
Suppressed responses during wakefulness and SWS. A, An example neuron whose response was suppressed during presentation of a 20 kHz pure tone (70 dB SPL) and for a short time following (vertical lines represent analysis window returned by windowing algorithm, see Materials and Methods). Suppression was weaker and shorter-lasting in SWS (dashed) than in awake (solid) (gain = −24%). Curves were generated by first subtracting spontaneous rates and then smoothing with a 50 ms moving average window. B, Percentage change of the strength of suppression in SWS. The distribution is shifted toward negative gains (mean = −23%, white inverted triangle) indicating that responses were not suppressed as strongly in SWS as in wakefulness. Inset, Population-averaged firing during suppression events did not go as far below baseline firing (0 in this figure) during SWS as during wakefulness.
Figure 5.
Figure 5.
Population-averaged activity during wakefulness and SWS. A, Changes in population-averaged driven and suppressed responses as a function of sound level. Suppressed responses were weakened in SWS across a wide range of sound levels (negative blue bars). However, driven responses were weakened only at extremely quiet sound levels (negative red bars). Population-averaged activity was obtained by summing firing rates of all detected driven or suppressed events at each sound level without normalizing and then computing the percentage gain between awake and SWS. Error bars represent ±1 SEM. B, Population-averaged histogram of all driven (positive) and suppressed (negative) responses showing their time course. Because SWS responses (light gray) were not driven or suppressed as strongly as in awake (dark gray), the dynamic range of SWS was limited (light shaded area is encompassed by dark area). Population poststimulus time histograms were obtained by averaging all detected driven (n = 3133) and suppressed events (n = 272) during the time window in which they occurred without normalizing. Responses were smoothed by a 30 ms moving average window.
Figure 6.
Figure 6.
Driven and suppressed responses in REM. A, For A1 neurons that responded in either the quiet (0–20 dB) or loud (70–90 dB) sound level regimes, little difference was seen in REM modulation of responses (median gain quiet = −1.3% vs loud = −5.3%, p = 0.28, Wilcoxon rank sum, n = 63). No clear difference was apparent in population firing rates for quiet sounds (awake = 12.0 + 1.3 vs REM = 10.7 + 1.2 spikes s−1, p = 0.35, Wilcoxon rank sum, n = 67). Inset, Black, awake; orange, REM). B, Percentage change of suppressed responses during REM in A1. The distribution is near 0 (mean = −0.3%, inverted white triangle), indicating that the strength of suppression was similar in awake and REM, which can be seen in mean population suppression (inset).
Figure 7.
Figure 7.
Influence of slow rhythms on neural activity in awake, SWS, and REM. A, An example neuron whose background activity showed EEG state-dependent firing rate modulation (left bars). Trials (n = 35) were divided into quartiles based on EEG amplitude. Trials in the lower quartile (n = 9) and the upper quartile (n = 9) were compared for effects of firing rate modulation with EEG amplitude. During EEG down states, this example neuron's firing rate was reduced by more than half. Upon acoustic stimulation with a 11.9 kHz pure tone (70 dB SPL), there was no longer a difference in total firing rates between up and down EEG states (right bars, spontaneous firing rate not subtracted). Error bars represent ±1 SEM. B, EEG amplitude modulated spiking especially when no sounds were playing in SWS (gray bar, no sound condition). Effects were generally stronger in SWS than in REM (orange) or wakefulness (black). During acoustic stimulation, however, modulation of spike rate by EEG amplitude became much weaker compared with the activity evoked by sounds (compare no sound to sound conditions; SWS: no sound = 68 ± 6% vs sound = 26 ± 2%, p < 0.01, Wilcoxon rank sum, n = 96) and slow rhythm modulation no longer differed between SWS and wakefulness (sound condition: SWS = 26 + 2% vs awake = 27 + 2%, p = 0.85, Wilcoxon rank sum, nSWS = 96, nAwake = 75). Only neurons with spontaneous rates > 3 spikes s−1 were included in this analysis so that appreciable variability occurred in trial firing rates. Error bars represent ±1 SEM. C, Locking of spontaneous activity to low-frequency EEG rhythms was enhanced in SWS compared with wakefulness (solid gray and black lines). This cannot be simply explained by the stronger power in the low-frequency EEG in SWS since the spike-field coherence measure normalizes for differences in EEG power across the different behavioral states (see Materials and Methods). In general, locking to low-frequency rhythms was poor while sounds were being played (dashed lines). Error bars represent ±1 SEM. D, High (top quartile of EEG amplitudes) and low (bottom quartile) trials could cause a 75 ± 9% swing in firing rates as seen in the overall modulation in spontaneous firing rate between up and down periods (black bar). This modulation with EEG amplitude, however, was reduced to 27 + 3% and 23 + 3% during playing of quiet (green, 0–20 dB) and loud (blue, 70–90 dB) sounds respectively (p(no sound vs quiet sound) = 1.4*10−5, p(no sound vs loud sound) = 5.5*10−6, Wilcoxon rank sum, nno sound = 51, nquiet = 25, nloud = 40). Only neurons with spontaneous rates > 3 spikes s−1 were used in this analysis. Otherwise, if firing rates were too low, little trial-by-trial variation could be observed. Error bars represent ±1 SEM. E, The SFC was strongest for low frequencies indicating that spikes were locked to slow brain rhythms. This locking was strongly diminished whether quiet (0–20 dB) or loud (70–90 dB) sounds were played (SFC at 1 Hz: no sound = 4.3*10−3 + 0.4*10−3 vs quiet sound = 2.1*10−3 + 0.3*10−3 mV2 vs loud sound = 1.8*10−3 + 0.4*10−3 mV2, p(no sound vs quiet sound) < 0.01, p(no sound vs loud sound) < 0.01, Wilcoxon rank sum, n = 169). Error bars represent ±1 SEM.

References

    1. Bastuji H, Perrin F, Garcia-Larrea L. Semantic analysis of auditory input during sleep: studies with event related potentials. Int J Psychophysiol. 2002;46:243–255. - PubMed
    1. Bonnet MH. Performance during sleep. In: Webb WB, editor. Biological rhythms, sleep and performance. Chichester, UK: Wiley; 1982. pp. 205–237.
    1. Brugge JF, Merzenich MM. Responses of neurons in auditory cortex of the macaque monkey to monaural and binaural stimulation. J Neurophysiol. 1973;36:1138–1158. - PubMed
    1. Canolty RT, Edwards E, Dalal SS, Soltani M, Nagarajan SS, Kirsch HE, Berger MS, Barbaro NM, Knight RT. High gamma power is phase-locked to theta oscillations in human neocortex. Science. 2006;313:1626–1628. - PMC - PubMed
    1. Carskadon MA, Rechtschaffen A. Monitoring and staging human sleep. In: Kryger MH, Roth T, Dement WC, editors. Principles and practices of sleep medicine. Ed 3. Philadelphia: W.B. Saunders; 2000. pp. 1197–1215.

Publication types

LinkOut - more resources