. 2011 Feb 23;31(8):2983-95.
doi: 10.1523/JNEUROSCI.5333-10.2011.

Linking topography to tonotopy in the mouse auditory thalamocortical circuit

Affiliations

Linking topography to tonotopy in the mouse auditory thalamocortical circuit

Troy A Hackett et al. J Neurosci. .

Abstract

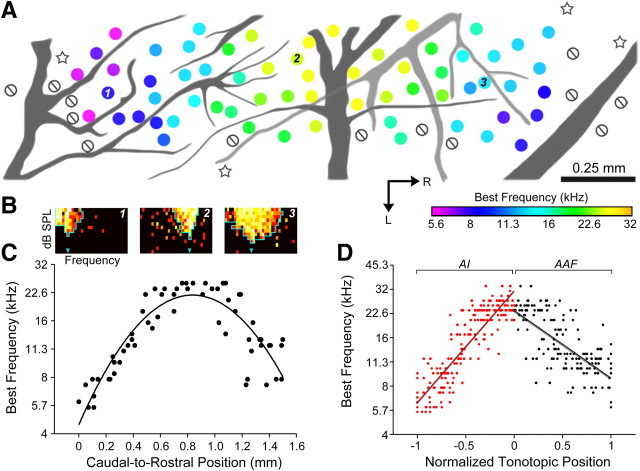
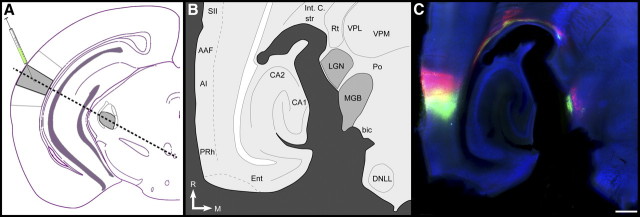
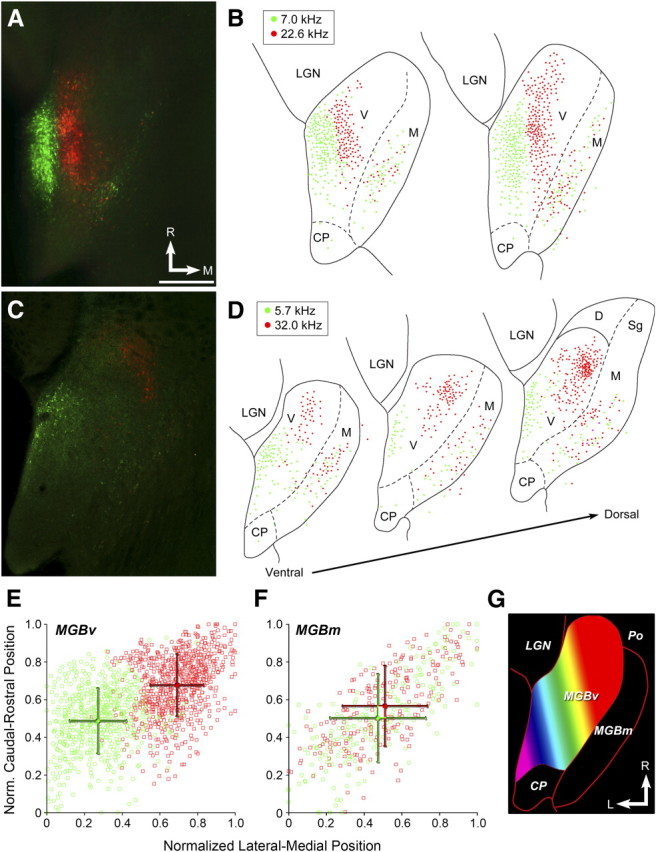
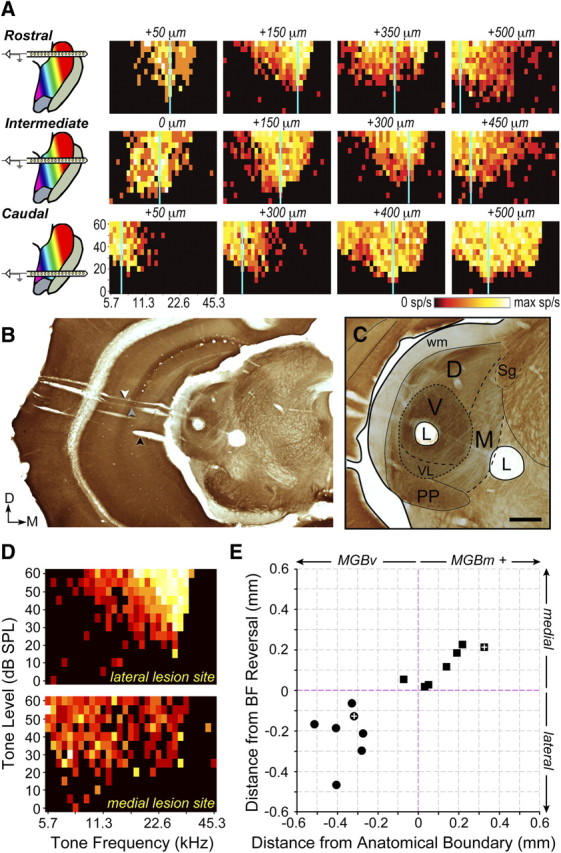
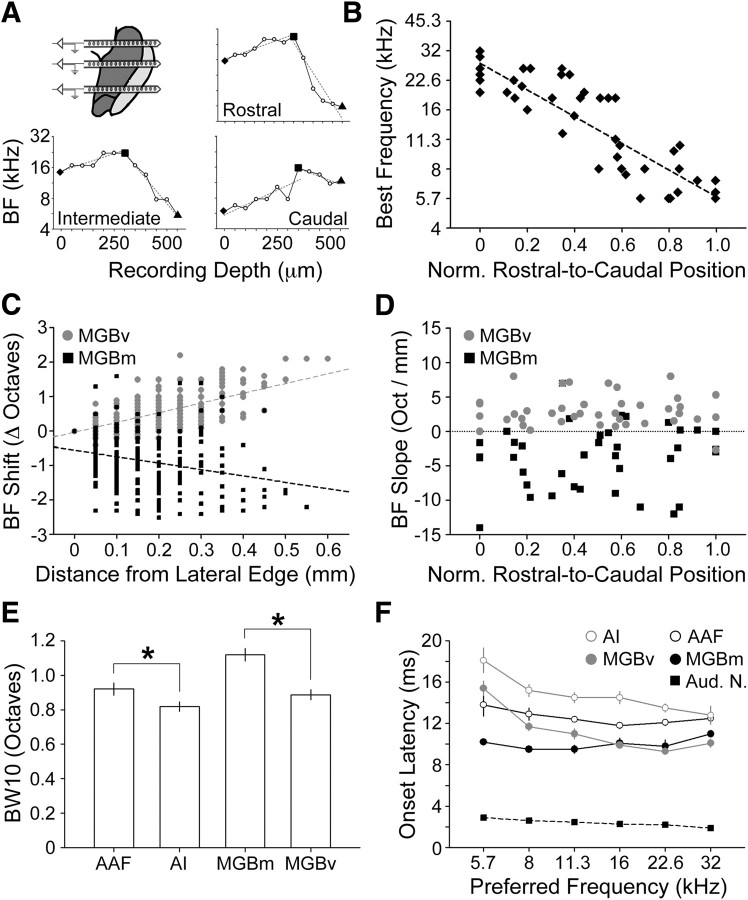
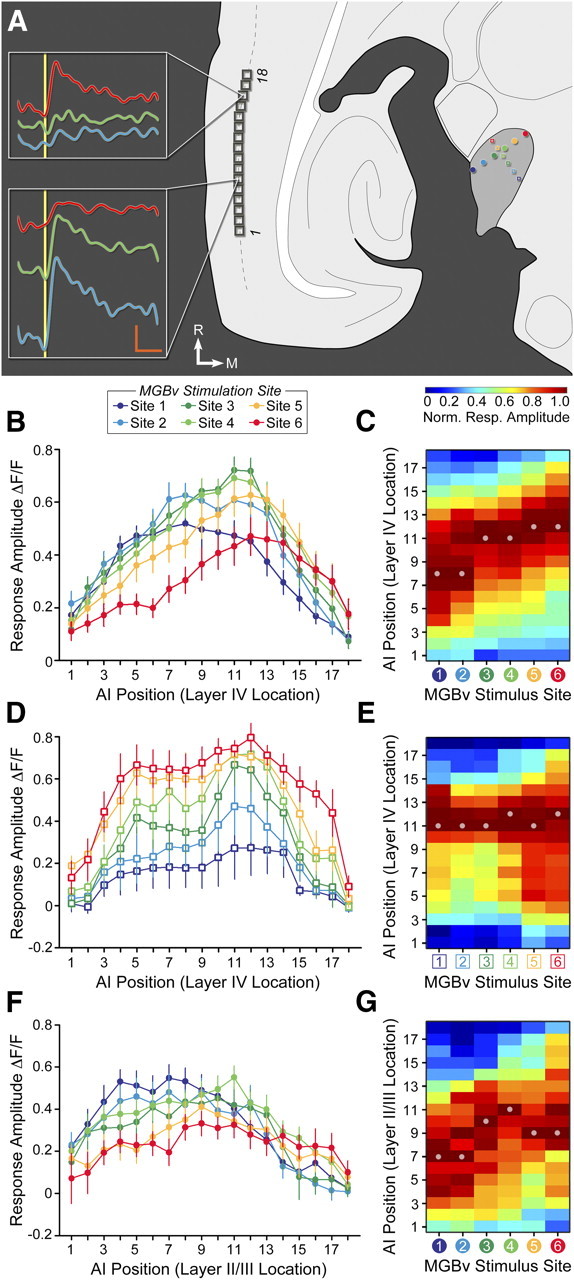
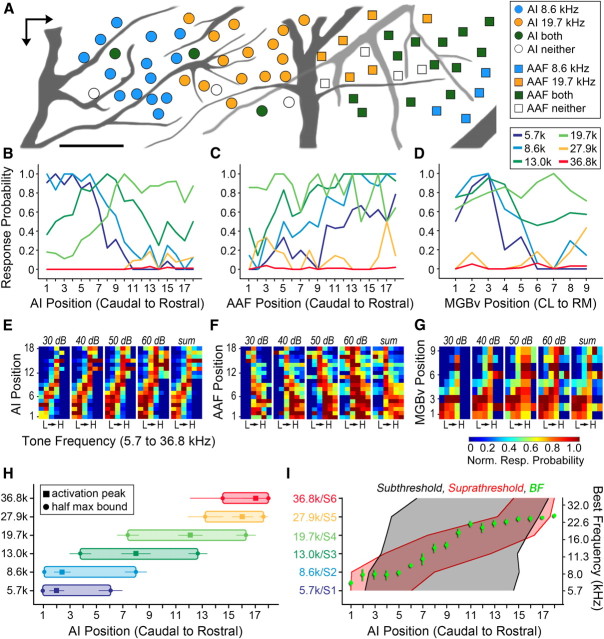
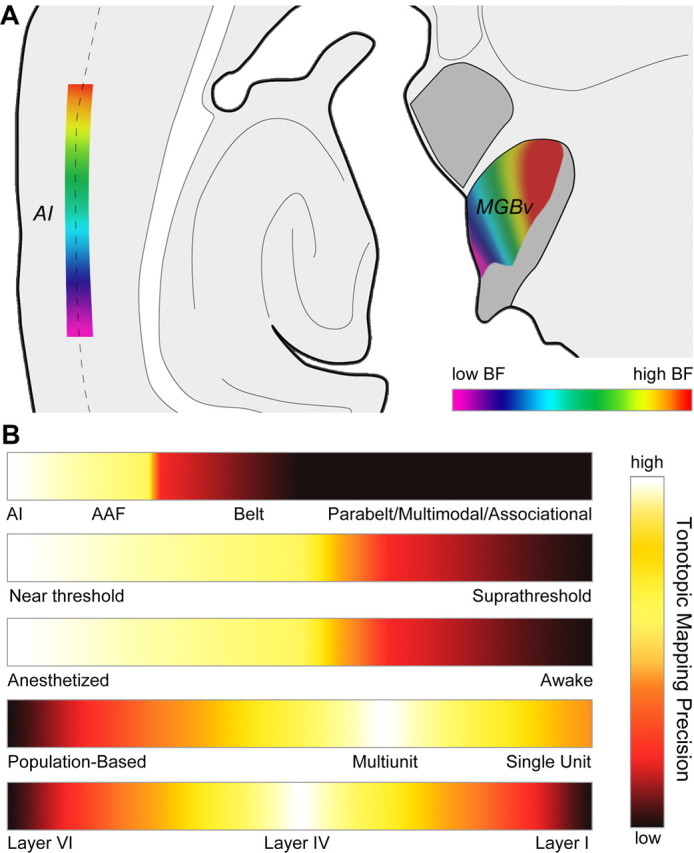
The mouse sensory neocortex is reported to lack several hallmark features of topographic organization such as ocular dominance and orientation columns in primary visual cortex or fine-scale tonotopy in primary auditory cortex (AI). Here, we re-examined the question of auditory functional topography by aligning ultra-dense receptive field maps from the auditory cortex and thalamus of the mouse in vivo with the neural circuitry contained in the auditory thalamocortical slice in vitro. We observed precisely organized tonotopic maps of best frequency (BF) in the middle layers of AI and the anterior auditory field as well as in the ventral and medial divisions of the medial geniculate body (MGBv and MGBm, respectively). Tracer injections into distinct zones of the BF map in AI retrogradely labeled topographically organized MGBv projections and weaker, mixed projections from MGBm. Stimulating MGBv along the tonotopic axis in the slice produced an orderly shift of voltage-sensitive dye (VSD) signals along the AI tonotopic axis, demonstrating topography in the mouse thalamocortical circuit that is preserved in the slice. However, compared with BF maps of neuronal spiking activity, the topographic order of subthreshold VSD maps was reduced in layer IV and even further degraded in layer II/III. Therefore, the precision of AI topography varies according to the source and layer of the mapping signal. Our findings further bridge the gap between in vivo and in vitro approaches for the detailed cellular study of auditory thalamocortical circuit organization and plasticity in the genetically tractable mouse model.


Figures

Figure 1.
Figure 1.
Tonotopic organization in the middle layers of AI and AAF. A, Positions of recording sites from the right hemisphere of a representative mouse are referenced to the branching patterns of the rhinal vein (dark gray) and middle cerebral artery (light gray). The color of each circle indicates the BF measured at that site, null symbol indicates no tuning, and stars indicate poorly tuned sites judged to be outside of AI or AAF. B, Example FRAs measured at the numbered positions in A. The downward arrow represents BF, and the outline represents the low- and high-frequency borders of the FRA at each SPL. C, BF measurements from the recording sites shown in A are plotted according to their position along a caudal-to-rostral line beginning at the caudal edge of AI. D, Scatterplot of all BF values across normalized tonotopic position in AI and AAF. Linear fit lines are superimposed. R, Rostral; L, lateral. Scale bar, 0.25 mm.
Figure 2.
Figure 2.
Tonotopic organization of MGBv projections to AI. A, Schematized coronal section through the mouse brain indicating the relative locations of AI and MGBv (gray shading), the position of CTB injections, and the plane of the section used to achieve the thalamocortical slice (dashed black line). B, Schematic representation of major brain nuclei contained within the auditory thalamocortical brain slice. C, Auditory thalamocortical slice immunoreacted for parvalbumin (blue). CTB-green and CTB-red were injected into 7 and 22.6 kHz domains in AI, respectively. SII, Secondary somatosensory cortex; Int C, internal capsule; str, superior thalamic radiation; Rt, reticular nucleus; VPL, ventral posterolateral thalamic nucleus; VPM, ventral posteromedial thalamic nucleus; LGN, lateral geniculate nucleus; Po, posterior thalamic complex; bic, brachium of the inferior colliculus; DNLL, dorsal nucleus of the lateral lemniscus; Ent, entorhinal cortex; PRh, perirhinal cortex; R, rostral; M, medial. Scale bar, 0.25 mm.
Figure 3.
Figure 3.
Topographic projections from MGBv, but not MGBm, to AI. A–D, Fluorescence microscopy (A, C) and retrogradely labeled cell body reconstructions (B, D) from a mouse with CTB injected into 7 and 22.6 kHz AI domains (A, B) or 5.7 and 32 kHz domains (C, D). E, F, Relative position of all retrogradely labeled cells in MGBv (E) and MGBm (F) from low (green) and high (red) injections. Data points in foreground of scatterplots reflect mean rostral-caudal and lateral-medial positions ± SEMs. G, Schematic of proposed tonotopic gradient with MGBv. Warmer colors represent higher-frequency BFs. V, MGBv; M, MGBm; D, dorsal division of MGB; CP, caudal pole; Sg, suprageniculate nucleus; R, rostral; M, medial; L, lateral. Scale bar, 0.25 mm.
Figure 4.
Figure 4.
Neurophysiological dissociation of MGBv from MGBm. A, Recordings were made along the lateral-to-medial extent of the MGB (across columns) using a multichannel silicon probe inserted along the same plane used for the thalamocortical slice. Multiple penetrations were made in each mouse to permit comparison of recordings made across the rostral-to-caudal extent of the MGB (across rows). Distance from the lateral wall of the MGBv is stated for FRA. Vertical blue line represents BF. B, C, low- and high-power images of a coronal section reacted for cytochrome oxidase. The black arrow indicates the initial probe insertion to locate the ventral margin of the MGB (see Materials and Methods), the gray arrow indicates the track made by the silicon probe penetration used for recordings, and the white arrow represents the electrode track used to create the lesions. C, High-power image depicts the location of two lesions (L) drawn relative to neighboring anatomical landmarks. D, FRAs measured immediately before lesioning at the lateral and medial lesion sites shown in B and C. E, The location of lesions made lateral or medial to the BF reversal point (circles and squares, respectively) are shown relative to the anatomical boundary dividing MGBv from MGBm, along with the electrode travel distance from the frequency reversal. MGBm+ indicates that data points could have been drawn from auditory-responsive sites medial to the MGBm. White crosses represent the lesions shown in B and C. sp/s, Spikes per second; PP, peripeduncular nucleus; wm, white matter. Scale bar, 0.25 mm.
Figure 5.
Figure 5.
Tonotopic organization of MGBv and MGBm. A, Examples of nonmonotonic BF functions across the lateral-to-medial depth within MGB obtained from rostral, intermediate, and caudal positions. The high-frequency reversal was used to divide MGBv (diamond to square) from MGBm (square to triangle) recording sites. Dashed lines represent linear fits of MGBv and MGBm BF functions used to calculate BF slope (D). B, BF measurements across the rostral-to-caudal extent of the lateral wall of MGBv. Dashed line represents linear fit. C, BF changes across the lateral-to-medial extent of MGBv (gray circles) and MGBm (black squares). Dashed lines indicate linear fits applied to BF shift data from MGBv (gray) or MGBm (black). D, Slope of BF changes across the rostral-to-caudal extent of the MGB. Positive values indicate increasing BF functions; negative values indicate decreasing BF functions. E, Mean ± SEM FRA bandwidth measured 10 dB above the minimum response threshold. Asterisks indicate statistically significant differences using an unpaired t test (p < 0.05). F, Mean ± SEM first spike latency as a function of BF for MGB and cortex and characteristic frequency for auditory nerve fiber recordings. Bins are 0.5 octaves wide beginning at the value indicated by the tick label. Norm., Normalized; Aud. N., auditory nerve.
Figure 6.
Figure 6.
Topographic mapping in the thalamocortical slice. A, Thalamocortical slice schematic represents the orientation of the six MGBv stimulation sites used for optimized (filled circles) and orthogonal (open squares) comparisons as well as 18 ROIs positioned atop layer IV (dashed gray line). Insets, Representative VSD signals evoked from ROI 16 or 6 from a 1 m current pulse (vertical yellow bar) to the color-matched region of MGBv. Vertical orange bar, 0.03% fractional change in signal strength; horizontal orange bar, 0.1 s. B–G, Fractional change in VSD response amplitudes across the 18 ROIs positioned in layer IV for the optimized stimulus orientation (B, C) and orthogonal orientation (D, E), and in layer II/III for the optimized trajectory (F, G). C, E, G, Surface plots represent fractional change in VSD response amplitudes that have been normalized for each stimulation site. For optimized stimulation orientation, site 1 is caudolateral and site 6 is rostromedial. For orthogonal stimulation, site 1 is caudomedial and site 6 is rostrolateral. Dots indicate location of peak cortical VSD signal. Norm., Normalized; Resp., response.
Figure 7.
Figure 7.
Analysis of spatially distributed tone representations. A, Color of the same AI (circles) and AAF (squares) recording sites shown in Figure 1 represents whether they contained 8.6 and/or 19.7 kHz tones at 50 dB SPL in their FRA. B–D, AI (B) and AAF (C) recording sites were divided into 18 ROIs ordered by their caudal-to-rostral position; MGBv recording sites (D) were grouped into 9 ROIs according to their location along the caudolateral-to-rostromedial (CL and RM, respectively) axis. Line plots represent the probability that recording sites within each ROI contain each of six different 50 dB SPL tones in their FRA. E–G, Surface plots represent the relative probability that recording sites in each ROI will contain the same six frequencies ranging from low (L) to high (H) in their FRA when presented at various sound levels or the summed probability across all sound levels in AI (E), AAF (F), and MGBv (G). H, Mean ± SEM ROI position of normalized probability peak (square) and the half-height boundaries measured caudal and rostral to the peak for each stimulation frequency in AI. Data are derived from the sum of sound levels. I, Mean caudal and rostral half-height response boundaries derived from AI VSD maps (black) and AI normalized response probability functions (red). Mean ± SEM BF within each ROI is superimposed (green). Norm., Normalized; Resp., response; S, MGBv stimulation site.
Figure 8.
Figure 8.
Implications for future studies of tonotopy in the thalamocortical circuit. A, Superposition of tonotopic gradients derived from measurements in intact mice onto a schematic of the mouse auditory thalamocortical brain slice. B, Precision of the tonotopic mapping signal is mediated by where recordings are made within the auditory cortex, the sound level used for characterization of preferred tuning, the state of vigilance, the spatial resolution of the measurement, and the cortical layer from which recordings are made (from top to bottom).

Similar articles

Cited by

References

    1. Atencio CA, Schreiner CE. Laminar diversity of dynamic sound processing in cat primary auditory cortex. J Neurophysiol. 2010a;103:192–205. - PMC - PubMed
    1. Atencio CA, Schreiner CE. Columnar connectivity and laminar processing in cat primary auditory cortex. PLoS One. 2010b;5:e9521. - PMC - PubMed
    1. Bakin JS, Weinberger NM. Classical conditioning induces CS-specific receptive field plasticity in the auditory cortex of the guinea pig. Brain Res. 1990;536:271–286. - PubMed
    1. Bandyopadhyay S, Shamma SA, Kanold PO. Dichotomy of functional organization in the mouse auditory cortex. Nat Neurosci. 2010;13:361–368. - PMC - PubMed
    1. Barbour DL, Callaway EM. Excitatory local connections of superficial neurons in rat auditory cortex. J Neurosci. 2008;28:11174–11185. - PMC - PubMed

Publication types