. 2011 Jul;39(13):5356-68.
doi: 10.1093/nar/gkr128. Epub 2011 Mar 16.

Specific inhibition of NF-Y subunits triggers different cell proliferation defects

Affiliations

Specific inhibition of NF-Y subunits triggers different cell proliferation defects

Paolo Benatti et al. Nucleic Acids Res. 2011 Jul.

Abstract

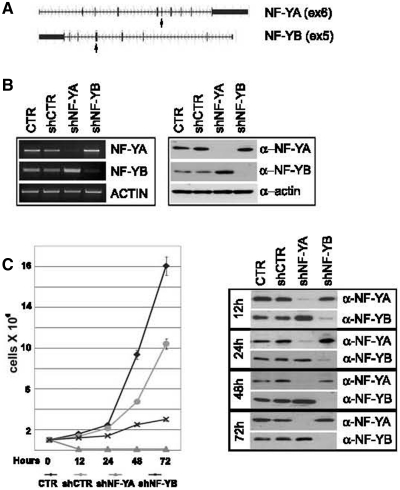
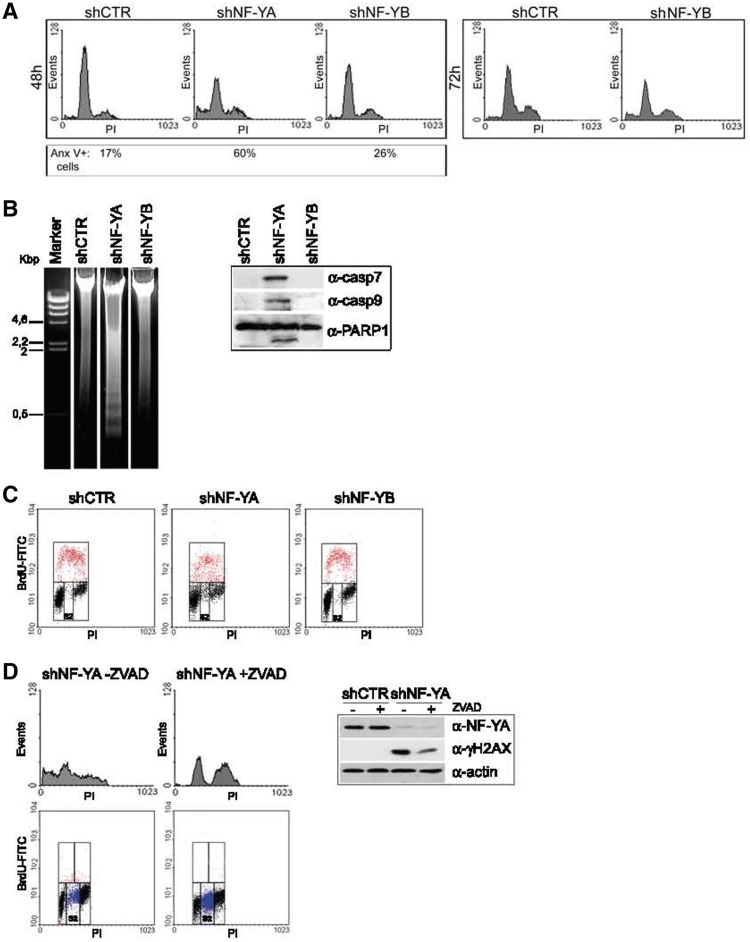
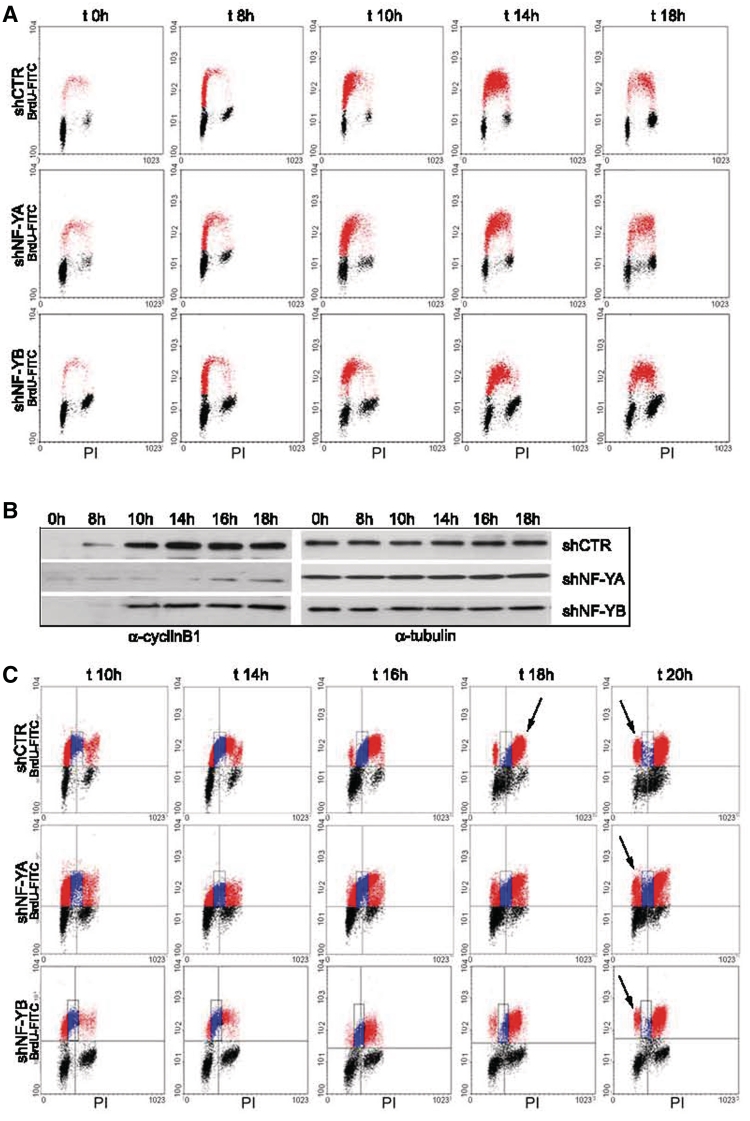
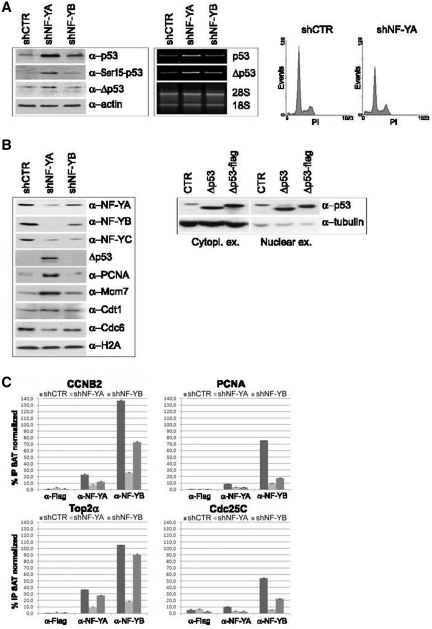
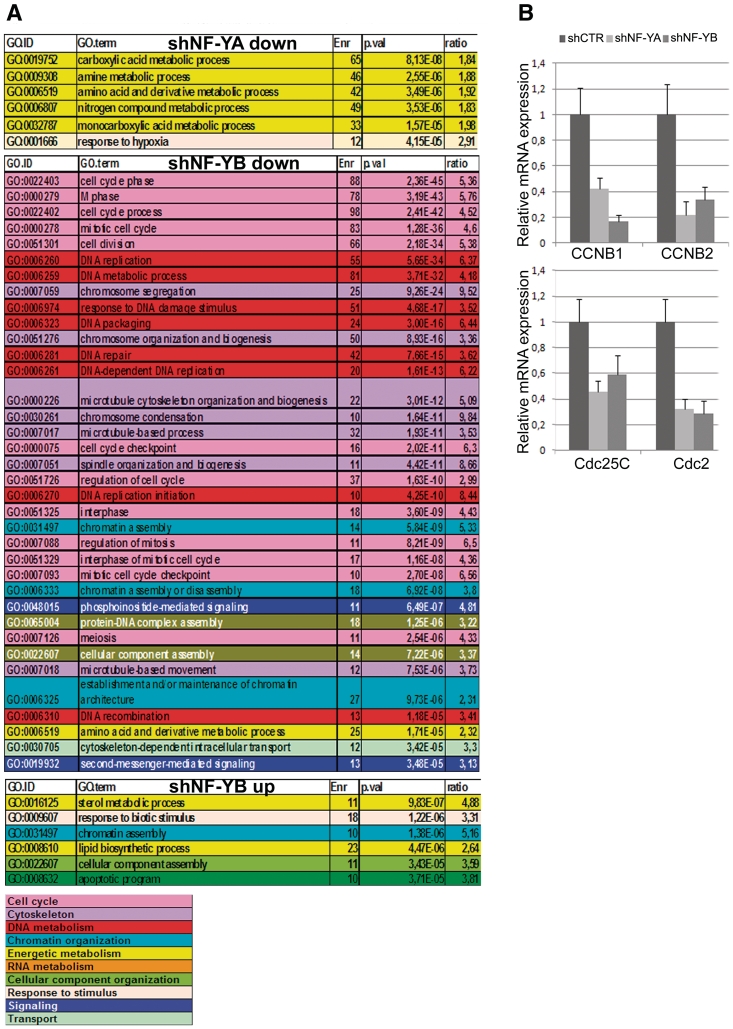
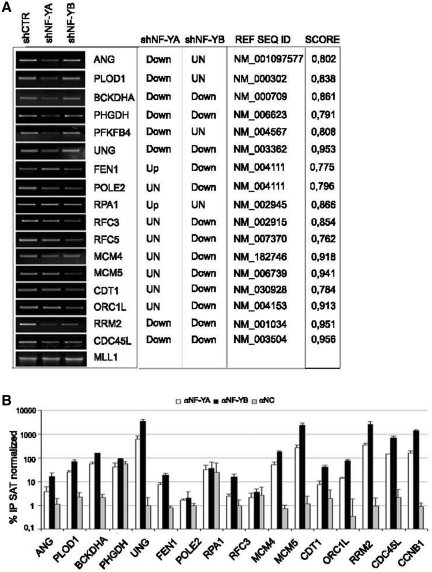
Regulated gene expression is essential for a proper progression through the cell cycle. The transcription factor NF-Y has a fundamental function in transcriptional regulation of cell cycle genes, particularly of G2/M genes. In order to investigate common and distinct functions of NF-Y subunits in cell cycle regulation, NF-YA, NF-YB and NF-YC have been silenced by shRNAs in HCT116 cells. NF-YA loss led to a delay in S-phase progression, DNA damage and apoptosis: we showed the activation of the replication checkpoint, through the recruitment of Δp53 and of the replication proteins PCNA and Mcm7 to chromatin. Differently, NF-YB depletion impaired cells from exiting G2/M, but did not interfere with S-phase progression. Gene expression analysis of NF-YA and NF-YB inactivated cells highlighted a common set of hit genes, as well as a plethora of uncommon genes, unveiling a different effect of NF-Y subunits loss on NF-Y binding to its target genes. Chromatin extracts and ChIP analysis showed that NF-YA depletion was more effective than NF-YB in hitting NF-Y recruitment to CCAAT-promoters. Our data suggest a critical role of NF-Y expression, highlighting that the lack of the single subunits are differently perceived by the cells, which activate diverse cell cycle blocks and signaling pathways.


Figures

Figure 1.
Figure 1.
(A) shRNAs were designed on human NF-YA and NF-YB genes, targeting exons 6 and 5, respectively (arrows). (B) Transcription (left panel) and protein levels (right panel) of NF-YA and NF-YB subunits after 48 h of shRNA lentiviral infection of HCT116 cells. (C) Left panel: growth rate of control and shRNA-infected HCT116 cells. Forty eight hours post-infection cells were trypsinized and equal number of cells were seeded into new culture dishes (time = 0 h). Viable cells were estimated after 12, 24, 48 and 72 h post-seeding. Right panel: western blot analysis of total extracts of control and shRNA infected cells. Actin was used as loading control.
Figure 2.
Figure 2.
(A) PI/monoparametric FACS analysis of HCT116 cells after 48 h of infection with shCTR, shNF-YA and shNF-YB (left panel) and 72 h of infection with shCTR and shNF-YB (right panel). The percentage of Annexin V-positive cells is indicated under each panel. (B) Left panel: DNA agarose gel electrophoresis showing the typical DNA ladder pattern of apoptosis after 48 h of shNF-YA infection. Right panel: expression analysis of cleaved caspase 7 and −9 and PARP1 in NF-YA or NF-YB silenced cells. (C) BrdU/PI cytofluorimetric analysis of HCT116 cells 48 h post-infection with shRNAs. Red dots represent BrdU-positive cells. (D) Left panel: PI (upper panel) and BrdU/PI (lower panel) cytoflurimetric analysis of NF-YA inactivated cells untreated or treated with the pan-caspase inhibitor ZVAD. Blue dots represent non-cycling S cells (S2). Right panel: NF-YA and γH2AX expression analysis of total extracts of shCTR and shNF-YA cells, untreated or treated with ZVAD. Actin was used as loading control.
Figure 3.
Figure 3.
(A) Time-course BrdU/PI cytofluorimetric analysis at time 0, 8, 10, 14 and 18 h post-release from serum starvation of shRNA infected cells. (B) CyclinB1 expression analysis of total extracts of shCTR, shNF-YA and shNF-YB cells at the indicated times after release from serum starvation. Tubulin was used as loading control. (C) BrdU pulse-chase biparametric FACS analysis of synchronized G0 cells upon NF-YA and NF-YB inactivation versus control cells.
Figure 4.
Figure 4.
(A) Left panel: p53, Phospho-Ser15 p53 and Δp53 expression analysis of HCT116 total extracts 48 h post-infection. Actin was used as loading control. Middle panel: RT-PCR analysis of p53 and Δp53 mRNA transcripts. Right panel: monoparametric cell cycle analysis of HCT116 p53−/− cells after shCTR and shNF-YA infection for 48 h. (B) Left panel: expression analysis of chromatin enriched extracts with the indicated antibodies. Right panel: p53 and Δp53 expresison analysis of cytoplasmic and nuclear extracts from HCT116 cells transiently transfected with Δp53 and Δp53-Flag. (C) ChIP analysis of NF-Y binding to the indicated CCAAT-promoters in shCTR, shNF-YA and shNF-YB cells. The enrichment was calculated as percentage IP recovery (%IP) of NF-YA and NF-YB over input normalized to satellite DNA. The input signal consists of 20% of the amount of chromatin used with each immunoprecipitation.
Figure 5.
Figure 5.
(A) Gene Ontology (GO) terms displaying a statistically significant over-representation in the sample sets (down- and up-regulated) retrieved from microarray expression analysis of NF-YA and NF-YB silenced versus shCTR cells. Terms have been pruned and grouped according to manually determined macro-categories identified by different colors. (B) mRNA expression analysis of CCNB1, CCNB2, Cdc25C and Cdc2 by real time RT-PCR. mRNA transcripts have been normalized versus TBP and β-actin expression levels.
Figure 6.
Figure 6.
(A) Semiquantitive RT-PCR validation of the profiling analysis of the indicated transcripts after NF-YA and NF-YB silencing compared to control cells. mRNA transcripts have been normalized versus MLL1 expression levels. The predicted changes of the expression levels from Illumina platform (up, down or unchanged), the Ref Seq ID and the estimated CCAAT score are indicated in the table. (B) ChIP analysis of NF-YA and NF-YB binding to the indicated genes in HCT116 cells. The enrichment was calculated as percentage IP recovery (%IP) of NF-YA and NF-YB over input normalized to satellite DNA.

References

    1. Mantovani R. The molecular biology of the CCAAT-binding factor NF-Y. Gene. 1999;239:15–27. - PubMed
    1. Bolognese F, Wasner M, Dohna CL, Gurtner A, Ronchi A, Muller H, Manni I, Mossner J, Piaggio G, Mantovani R, et al. The cyclin B2 promoter depends on NF-Y, a trimer whose CCAAT-binding activity is cell-cycle regulated. Oncogene. 1999;18:1845–1853. - PubMed
    1. Gurtner A, Manni I, Fuschi P, Mantovani R, Guadagni F, Sacchi A, Piaggio G. Requirement for down-regulation of the CCAAT-binding activity of the NF-Y transcription factor during skeletal muscle differentiation. Mol. Biol. Cell. 2003;14:2706–2715. - PMC - PubMed
    1. Chang ZF, Huang DY. Regulation of thymidine kinase expression during cellular senescence. J. Biomed. Sci. 2001;8:176–183. - PubMed
    1. Marziali G, Perrotti E, Ilari R, Testa U, Coccia EM, Battistini A. Transcriptional regulation of the ferritin heavy-chain gene: the activity of the CCAAT binding factor NF-Y is modulated in heme-treated Friend leukemia cells and during monocyte-to-macrophage differentiation. Mol. Cell Biol. 1997;17:1387–1395. - PMC - PubMed

Publication types