. 2012 Sep;38(5):967-80.
doi: 10.1093/schbul/sbq168. Epub 2011 Mar 17.

Emotion effects on attention, amygdala activation, and functional connectivity in schizophrenia

Affiliations

Emotion effects on attention, amygdala activation, and functional connectivity in schizophrenia

Alan Anticevic et al. Schizophr Bull. 2012 Sep.

Abstract

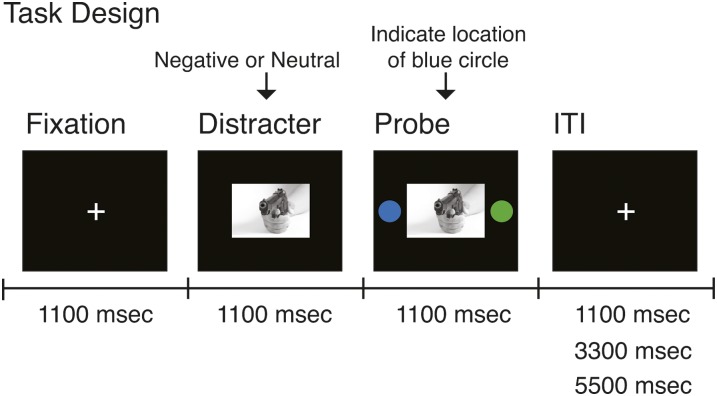
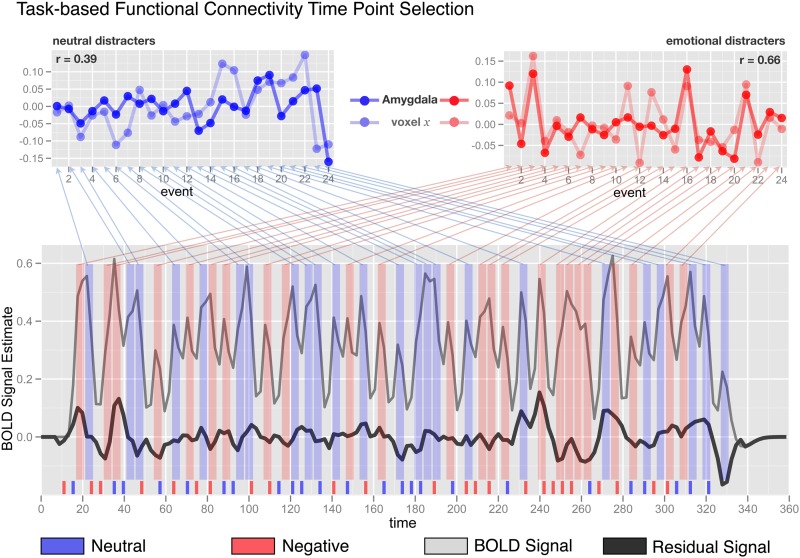
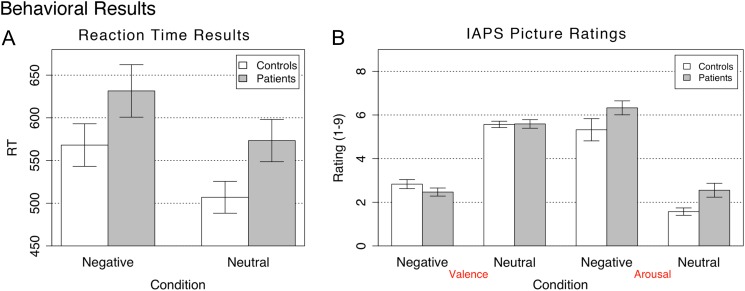
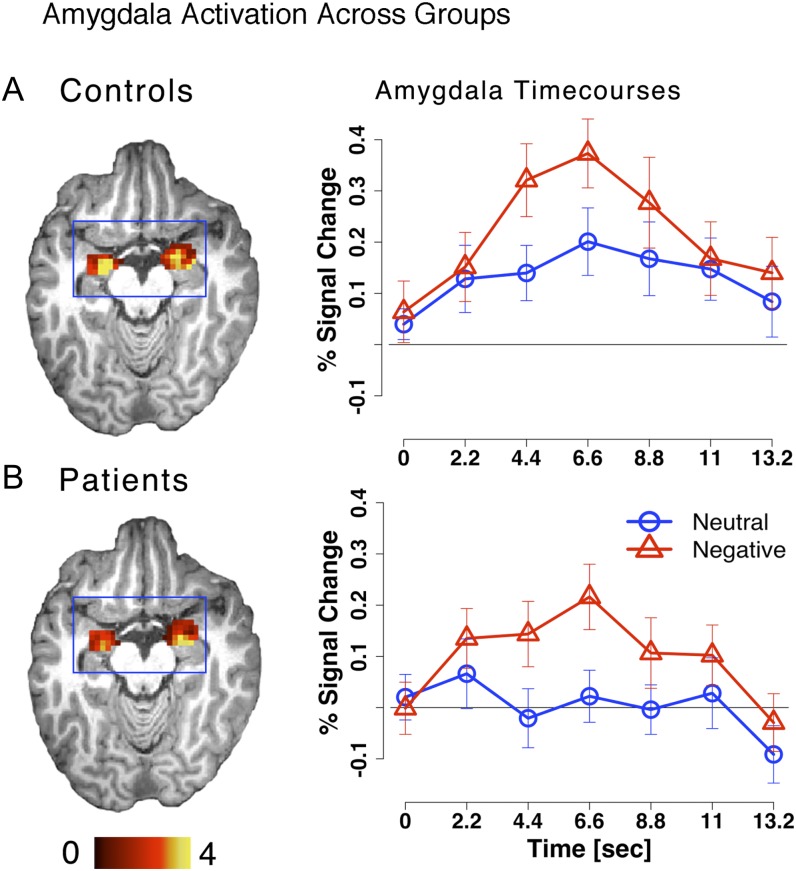
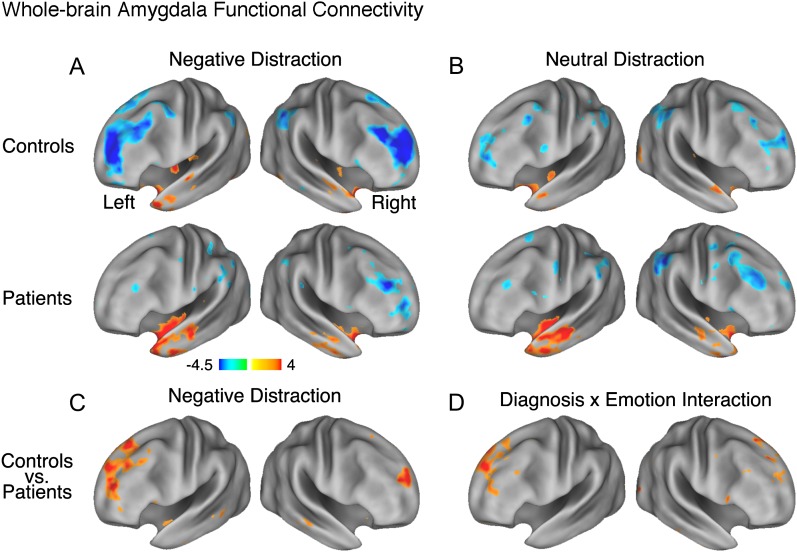
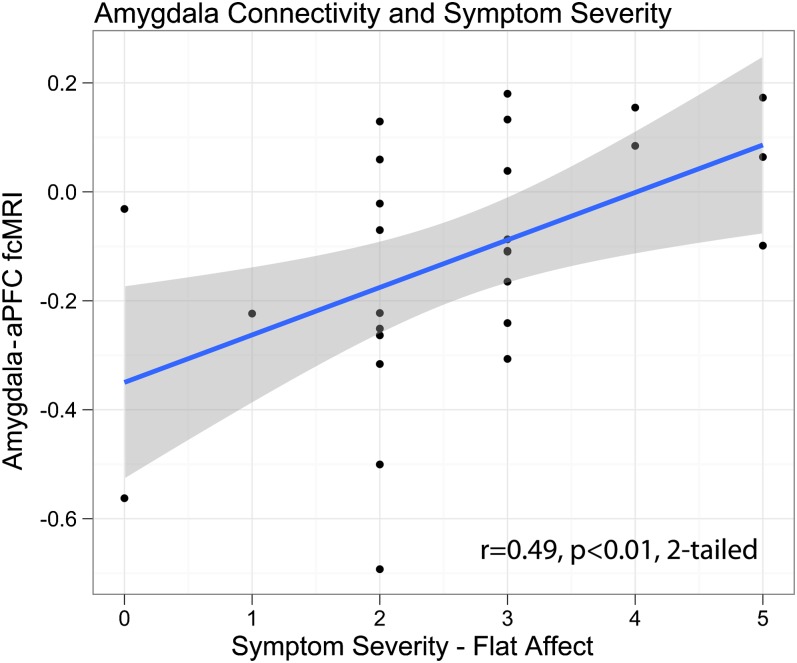
Emotional abnormalities are a critical clinical feature of schizophrenia (SCZ), but complete understanding of their underlying neuropathology is lacking. Numerous studies have examined amygdala activation in response to affective stimuli in SCZ, but no consensus has emerged. However, behavioral studies examining 'in-the-moment' processing of affect have suggested intact emotional processing in SCZ. To examine which aspects of emotional processing may be impaired in SCZ, we combined behavior and neuroimaging to investigate effects of aversive stimuli during minimal cognitive engagement, at the level of behavior, amygdala recruitment, and its whole-brain task-based functional connectivity (tb-fcMRI) because impairments may manifest when examining across-region functional integration. Twenty-eight patients and 24 matched controls underwent rapid event-related fMRI at 3 T while performing a simple perceptual decision task with negative or neutral distraction. We examined perceptual decision slowing, amygdala activation, and whole-brain amygdala tb-fcMRI, while ensuring group signal-to-noise profile matching. Following scanning, subjects rated all images for experienced arousal and valence. No significant group differences emerged for negative vs neutral reaction time, emotional ratings across groups, or amygdala activation. However, even in the absence of behavioral or activation differences, SCZ subjects demonstrated significantly weaker amygdala-prefrontal cortical coupling, specifically during negative distraction. Whereas in-the-moment perception, behavioral response, and amygdala recruitment to negative stimuli during minimal cognitive load seem to be intact, there is evidence of aberrant amygdala-prefrontal integration in SCZ subjects. Such abnormalities may prove critical for understanding disturbances in patients' ability to use affective cues when guiding higher level cognitive processes needed in social interactions.


Figures

Fig. 1.
Fig. 1.
The overall layout of the task is shown along with different components and their onsets marked along the timeline. During each trial, subjects were presented with a fixation cross for 1100 ms, followed by either a negative or neutral picture presented for a total of 2200 ms. 1100 ms following picture onset, 2 isoluminant circles were presented bilaterally and subjects’ reported, using a button response, on which side they see the blue circle. Each trial was followed by a randomly jittered intertrial interval (ITI). The aim of the task was to minimize cognitive load (via a simple perceptual decision) but still assay the effect of negative distraction on behavior via reaction time of making the perceptual decision.
Fig. 2.
Fig. 2.
Task-based functional connectivity (tb-fcMRI) time point selection approach used in the present study is shown on a simulated time series example. The bottom panel shows the overall original BOLD time series in light gray. The time series following overall task structure removal is shown in black and is substantially attenuated in overall variability. Negative and neutral events are marked in red and blue, respectively, across the figure. Event onset is shown at the bottom along the x-axis. The average of time points 4 and 5 following each event onset is marked with vertical red or blue bars spanning the y-axis of the bottom figure. The top panels show examples of 2 extracted and concatenated voxel trial-to-trial variability time series for neutral (left) and negative (right) conditions. All tb-fcMRI analyses are performed on these extracted time courses, which reflect variation in peak response following each distracter—as indicated by obtained correlation coefficients shown in corners of each top panel. As noted, this approach, along with removal of task structure, largely circumvents the concern that correlations are being driven by overall task response.
Fig. 3.
Fig. 3.
Behavioral results are shown for (A) probe reaction time during the fMRI task following negative and neutral picture presentation and (B) stimulus ratings across valence and arousal dimensions following scanning sessions. Results for patients and controls are shown in gray and white bars, respectively. Error bars represent ±1 standard error of the mean.
Fig. 4.
Fig. 4.
Amygdala activation is shown for (A) controls and (B) patients with the associated time courses extracted from bilateral amygdala ROIs. Time courses for the negative and neutral conditions are marked in red triangles and blue circles, respectively.
Fig. 5.
Fig. 5.
Whole-brain amygdala task-based functional connectivity (tb-fcMRI) maps are shown using Z statistics and visualized using the population-average, landmark- and surface-based (PALS) atlas. (A) Following negative distraction for both controls (top panel) and patients (bottom panel); (B) Following neutral distraction for both controls (top panel) and patients (bottom panel); (C) Results of an independent samples t-test comparing patients vs controls following negative distraction; (D) Results of a Diagnosis × Distracter Condition interaction (ie, foci where controls show increases in negative coupling between amygdala-PFC as a function of emotion and patients do not). In panels (C) and (D), we show foci using a Z > 2.5 threshold demonstrating that, even with a lower statistical significance threshold, group differences in amygdala tb-fcMRI are centered mainly on the prefrontal cortex and not elsewhere. Brighter colors mark regions showing either more positive or more negative tb-fcMRI with amygdala. The online version of this article shows positive and negative tb-fcMRI with the amygdala in orange–yellow and blue colors, respectively. The complete list of significant foci at appropriate whole-brain type I error correction (z > 3.00, k = 13, corresponding to P < .05) is shown in table 2.
Fig. 6.
Fig. 6.
Correlation between negative symptoms (flat affect) measured using SANS and tb-fcMRI between amygdala and fronto-polar cortex (aPFC) during neutral distraction.

Similar articles

Cited by

References

    1. Bleuler E. Dementia Praecox, or the Group of Schizophrenias. New York, NY: International Universities Press; 1911.
    1. Kraeplin E. Dementia Praecox and Paraphrenia. New York, NY: International Universities Press, Inc; 1950.
    1. Barch DM, Dowd EC. Goal representations and motivational drive in schizophrenia: the role of prefrontal-striatal interactions. Schizophr Bull. 2010;36:919–934. - PMC - PubMed
    1. Dowd EC, Barch DM. Anhedonia and emotional experience in schizophrenia: neural and behavioral indicators. Biol Psychiatry. 2010;67:902–911. - PMC - PubMed
    1. Gard DE, Kring AM, Gard MG, Horan WP, Green MF. Anhedonia in schizophrenia: distinctions between anticipatory and consummatory pleasure. Schizophr Res. 2007;93:253–260. - PMC - PubMed

Publication types

MeSH terms