. 2011 Mar 18;331(6023):1433-6.
doi: 10.1126/science.1198914.

Second-order selection for evolvability in a large Escherichia coli population

Affiliations

Second-order selection for evolvability in a large Escherichia coli population

Robert J Woods et al. Science. .

Abstract

In theory, competition between asexual lineages can lead to second-order selection for greater evolutionary potential. To test this hypothesis, we revived a frozen population of Escherichia coli from a long-term evolution experiment and compared the fitness and ultimate fates of four genetically distinct clones. Surprisingly, two clones with beneficial mutations that would eventually take over the population had significantly lower competitive fitness than two clones with mutations that later went extinct. By replaying evolution many times from these clones, we showed that the eventual winners likely prevailed because they had greater potential for further adaptation. Genetic interactions that reduce the benefit of certain regulatory mutations in the eventual losers appear to explain, at least in part, why they were outcompeted.


Figures

Fig. 1
Fig. 1
Fitness of two eventual winner (EW) and two eventual loser (EL) clones relative to the ancestor of the E. coli long-term evolution experiment. Error bars are 95% confidence intervals. All four clones were significantly more fit than the ancestor. Surprisingly, the EL clones were more fit than the EW clones, both as shown here and in direct competition with one another (Fig. S1).
Fig 2
Fig 2
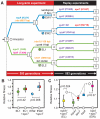
Replay evolution experiments to measure the evolvability of the four representative 500- generation clones. (A-B) The frequencies of Ara and Ara+ versions of each test strain, initially mixed equally, were recorded at regular intervals (symbols) during 883 generations of evolution under the same conditions as the long-term experiment. Marker trajectories for the replay populations initiated from EL1 and EW1 clones are shown (10 replicates each). Shifts in the Ara/Ara+ ratio occur when new beneficial mutations linked to one background arise and increase in frequency within the population. Fitting the replicate marker trajectories (lines and solid symbols) until they deviate significantly from an exponential model (hollow symbols) provides a distribution of empirical shape parameters for the initial divergence. (C) Effective mutation rates (μ) and fitness effects (s) for the first beneficial mutations to sweep to high frequency in a given genetic background were inferred by comparing experimental divergence parameters with those from simulated marker trajectories. Black rectangles represent maximum likelihood estimates. Representative EW and EL isolates were grouped for this analysis (19). Figure S2 shows data for EL2 and EW2 populations and other steps in the statistical analysis.
Fig 3
Fig 3
Greater evolvability of EW allows them to reproducibly overtake EL. Two representative EW clones from generation 500 of the long-term evolution experiment were initially at a significant fitness disadvantage relative to two contemporary EL clones (circles). The EW were somewhat closer in fitness to the EL, but still lagged behind on average, after the first beneficial mutations swept to high frequency in the replay evolution experiments (triangles), as determined by the marker trajectory divergence analysis. After 883 generations, the representative EW evolved to a higher fitness on average than the EL in the replay populations (pentagons). Percentage differences in fitness are for pooled EW versus EL at the highlighted time point, and P-values indicate whether this difference was significant (19). Arrows represent presumptive mutational steps, with dashes indicating that the exact number of mutations may vary. The Y-axis is unlabeled for the final 883-generation replay isolates because their fitness was measured with respect to each other, not relative to the long-term ancestor.
Fig 4
Fig 4
(A) Mutations identified by whole-genome re-sequencing of endpoint E. coli clones from the replay evolution experiments and inferred by parsimony in their EW and EL ancestors. Numbers in squares indicate how many mutations accumulated relative to the original long-term ancestor with mutations in key genes labeled. See Tables S2-S9 for complete lists of all mutations. (B) Fitness effects of adding the spoT mutation that fixed during the long-term experiment to the EL1 and EW2 genetic backgrounds, measured relative to the ancestral strain. Error bars are 95% confidence limits (hidden by symbols in some cases). P-values indicate the significance of the hypothesis that addition of the spoT mutation caused a fitness difference. (C) Fitness effects of the long-term spoT, EW topA, and EL topA1 mutations alone and in combination in the ancestral genetic background. Dashed lines converging on empty diamonds show the fitness predicted for each spoT and topA allele combination given independent multiplicative effects. P-values are for the hypothesis of no epistatic interactions under a multiplicative model (31).

References

    1. Pigliucci M. Is evolvability evolvable? Nat. Rev. Genet. 2008;9:75. - PubMed
    1. Fogle CA, Nagle JL, Desai MM. Clonal interference, multiple mutations and adaptation in large asexual populations. Genetics. 2008;180:2163. - PMC - PubMed
    1. Tenaillon O, Toupance B, Le Nagard H, Taddei F, Godelle B. Mutators, population size, adaptive landscape and the adaptation of asexual populations of bacteria. Genetics. 1999;152:485. - PMC - PubMed
    1. Weinreich DM, Watson RA, Chao L. Perspective: Sign epistasis and genetic constraint on evolutionary trajectories. Evolution. 2005;59:1165. - PubMed
    1. Chao L, Cox EC. Competition between high and low mutating strains of Escherichia coli. Evolution. 1983;37:125. - PubMed

Publication types