. 2011 Apr 29;108(9):1071-83.
doi: 10.1161/CIRCRESAHA.110.239459. Epub 2011 Mar 17.

The ephrin A1-EphA2 system promotes cardiac stem cell migration after infarction

Affiliations

The ephrin A1-EphA2 system promotes cardiac stem cell migration after infarction

Polina Goichberg et al. Circ Res. .

Erratum in

  • Correction.
    [No authors listed] [No authors listed] Circ Res. 2015 Dec 4;117(12):e129. doi: 10.1161/RES.0000000000000084. Circ Res. 2015. PMID: 26635383 No abstract available.
  • Correction.
    [No authors listed] [No authors listed] Circ Res. 2017 Jan 20;120(2):e1. doi: 10.1161/RES.0000000000000131. Circ Res. 2017. PMID: 28104775 No abstract available.

Retraction in

Expression of concern in

  • Expression of Concern.
    [No authors listed] [No authors listed] Circ Res. 2019 Jan 18;124(2):e4-e5. doi: 10.1161/RES.0000000000000241. Circ Res. 2019. PMID: 30582460 No abstract available.
  • Expression of Concern.
    [No authors listed] [No authors listed] Circulation. 2019 Jan 15;139(3):e5-e6. doi: 10.1161/CIR.0000000000000639. Circulation. 2019. PMID: 30615475 No abstract available.

Abstract

Rationale: Understanding the mechanisms that regulate trafficking of human cardiac stem cells (hCSCs) may lead to development of new therapeutic approaches for the failing heart.

Objective: We tested whether the motility of hCSCs in immunosuppressed infarcted animals is controlled by the guidance system that involves the interaction of Eph receptors with ephrin ligands.

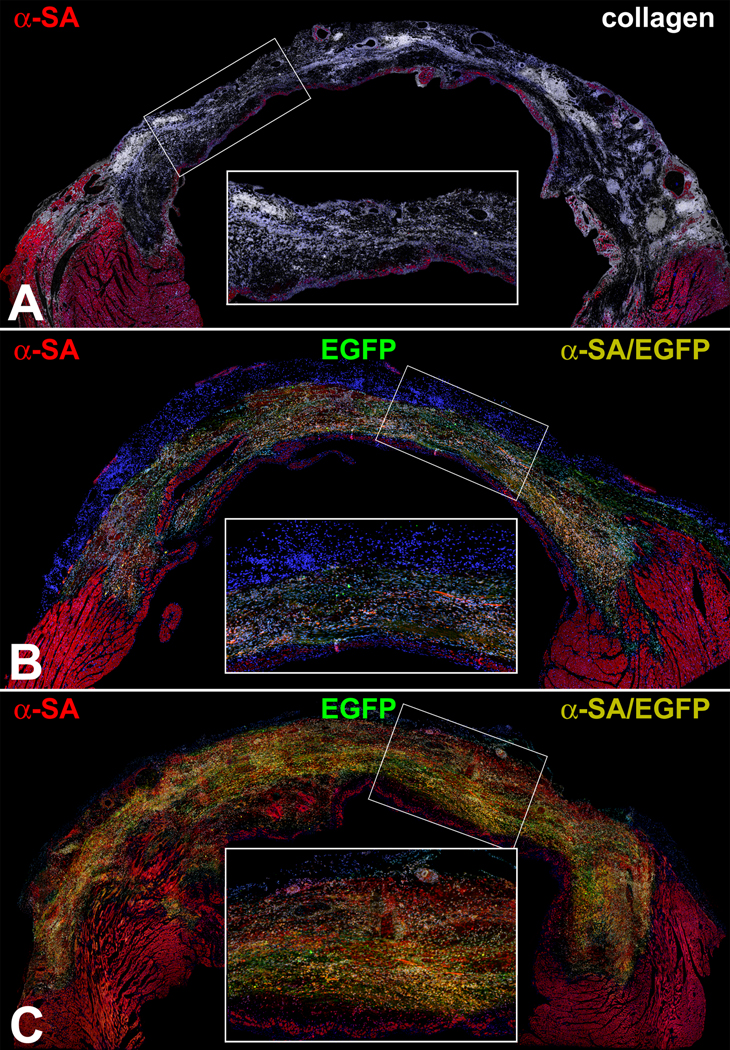
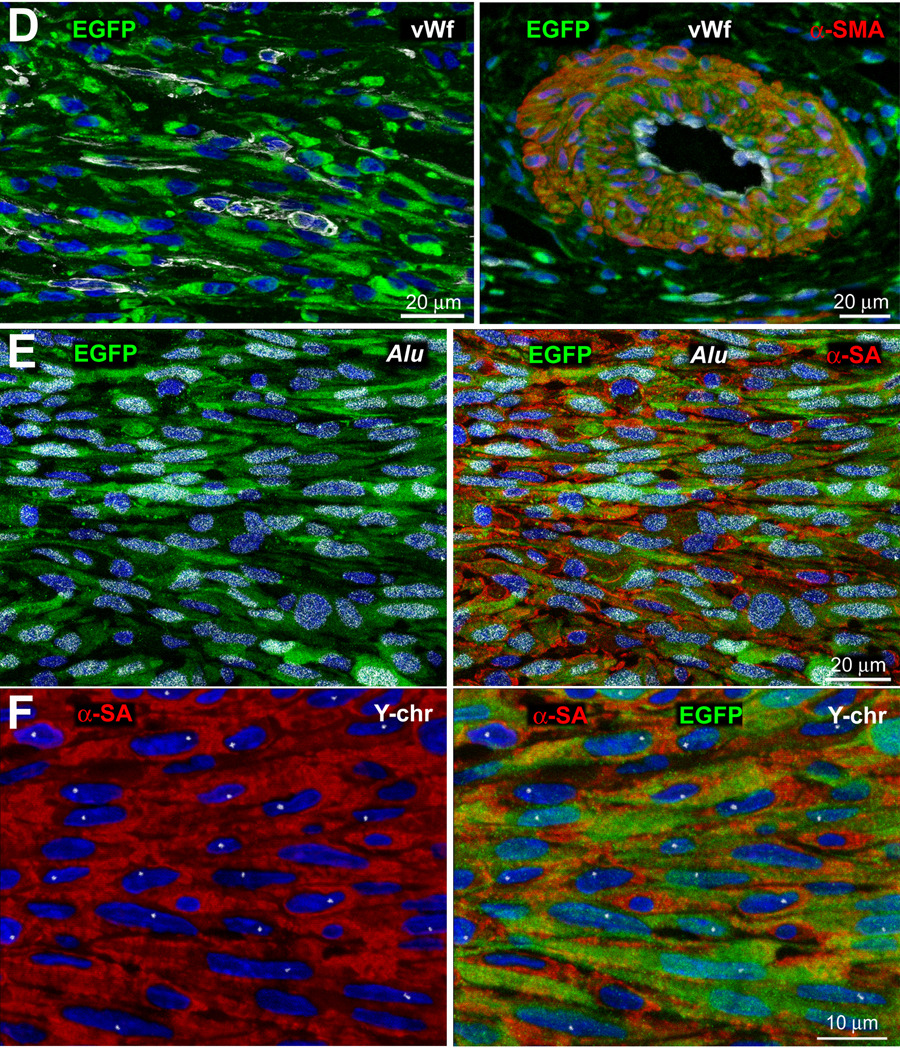
Methods and results: Within the cardiac niches, cardiomyocytes expressed preferentially the ephrin A1 ligand, whereas hCSCs possessed the EphA2 receptor. Treatment of hCSCs with ephrin A1 resulted in the rapid internalization of the ephrin A1-EphA2 complex, posttranslational modifications of Src kinases, and morphological changes consistent with the acquisition of a motile cell phenotype. Ephrin A1 enhanced the motility of hCSCs in vitro, and their migration in vivo following acute myocardial infarction. At 2 weeks after infarction, the volume of the regenerated myocardium was 2-fold larger in animals injected with ephrin A1-activated hCSCs than in animals receiving control hCSCs; this difference was dictated by a greater number of newly formed cardiomyocytes and coronary vessels. The increased recovery in myocardial mass with ephrin A1-treated hCSCs was characterized by further restoration of cardiac function and by a reduction in arrhythmic events.

Conclusions: Ephrin A1 promotes the motility of EphA2-positive hCSCs, facilitates their migration to the area of damage, and enhances cardiac repair. Thus, in situ stimulation of resident hCSCs with ephrin A1 or their ex vivo activation before myocardial delivery improves cell targeting to sites of injury, possibly providing a novel strategy for the management of the diseased heart.


Figures

Figure 1
Figure 1. Expression of EphA2 and ephrin A1
A, Transcripts for EphA2 and ephrin A1 in hCSCs, human cardiomyocytes (hCMs), mCSCs and mouse cardiomyocytes (mCMs). Representative tracings and quantitative data are shown. *P<0.05 vs. hCSCs or mCSCs. hMyo, human myocardium. For PCR products, see Online Figure I. B, Western blotting of EphA2 and ephrin A1 in hCSCs and hCMs. EphA2 is restricted to hCSCs and ephrin A1 to hCMs. Loading, GAPDH or β-actin. C, hCMs (α-sarcomeric actin: α-SA, red) express ephrin A1 (white) and are negative for EphA2. DAPI: nuclei, blue. D, c-kit-positive hCSCs (left, green) express EphA2 on the plasma membrane (central, red). Right, merge. E, Five hCSCs (c-kit, green) are nested within the hMyo (hCMs: α-SA, red) and express connexin 43 (C×43, white) and N-cadherin (N-cadh, yellow). The area included in the rectangle is shown at higher magnification in the inset. Fibronectin, magenta. F, Ephrin A1 (white) is present in hCMs (α-SA, red) located in proximity of c-kit-positive hCSCs (green) expressing EphA2 (yellow). The area included in the rectangle is shown at higher magnification in the inset. G, Ephrin A1 is restricted to hCMs and is not present in ECs (von Willebrand factor: vWf, magenta), SMCs (α-smooth muscle actin: α-SMA, green) and fibroblasts (procollagen1α: procoll, light blue).
Figure 2
Figure 2. Ephrin A1 activation of hCSCs
A, Transcripts for EphA2, EphA3 and EphA4 (left). siC, non-targeting siRNA. *P<0.05 vs. siC. Expression of EphA2 (right, red) in hCSCs transfected with siEphA2 or siC. Phalloidin, green. B, Fraction of hCSCs attached to immobilized ephrin A1 in the presence of non-targeting RNA (siC). Transfection of hCSCs with siRNA for EphA2 (siEphA2) abrogated the adhesion response. Human IgG coating (Fc) was used as control. *,**P<0.05 vs. Fc and siC, respectively. C, Actin filaments (phalloidin, green) in hCSCs exposed to Fc or ephrin A1. Actin accumulates at the leading lamella of ephrin A1-activated hCSCs. D, hCSCs expressing EphA2 (red) were exposed to Fc (upper panels) or ephrin A1 (lower panels). Internalization of the ephrin A1-EphA2 complex (red-white dots) occurs in ephrin A1-activated hCSCs. EphA2 is confined to the plasma membrane in Fc-exposed hCSCs. Fc alone and ephrin A1-Fc (white) were recognized by an antibody against the Fc portion of human IgG. Phalloidin, green. E, Immunoblotting and quantitative analysis of Src family kinase phosphorylation in hCSCs exposed to ephrin A1 for 0, 5, 15 and 30 minutes (min). *P<0.05 vs. time 0. F, Directional stimulation of hCSCs with HGF results in EphA2 (red) accumulation at the leading edge (arrowheads) of the migrating cells. Actin filaments are shown by phalloidin (green). Arrow, direction of migration; c-kit, white. Control, hCSCs in the absence of HGF. G, Number of migrated hCSCs. *P<0.05 vs. Fc. H, hCSCs migration is negatively affected by EphA2 siRNA (siEphA2) and chemical inhibition of Src kinase. siC, non-targeting RNA. *P<0.05 vs. control conditions. I, mRNA for α-SA, α-SMA and vWf (left), and fraction of myocytes, SMCs and ECs formed by hCSCs in the presence and absence of ephrin A1 (right). Control, hCSCs not exposed to dexamethasone.
Figure 3
Figure 3. Expression of ephrin A1 in diseased hearts
A, Two days after myocardial infarction, the expression of ephrin A1 (white) increases in the spared mCMs (right: α-SA, red). Sham-operated, SO (left). B, Immunoblotting of ephrin A1 and Src family kinase phosphorylation in myocardium obtained from SO, and from the remote region and border zone of infarcted mice. *P<0.05 vs. SO. C, Ephrin A1 mRNA in isolated hCMs from donor and explanted human hearts.
Figure 4
Figure 4. Ephrin A1 and mCSC migration
A, Two days after infarction, EGFP-positive-c-kit-positive (green) mCSCs are located at the border zone of infarcted mice injected with Fc or ephrin A1. Low and high magnifications are shown. mCMs: α-SA, red. MI, myocardial infarction. B, Number of mCSCs in the border zone of Fc- and ephrin A1-treated infarcted mice. *P<0.05 vs. Fc. C, Fraction of replicating (Ki67-positive) and dying (TdT-positive) mCSCs in the same region.
Figure 5
Figure 5. Ephrin A1 and migration of hCSCs in the infarcted heart
A, Images of the same field of the border zone of an infarcted heart are shown by two-photon-microscopy two hours after coronary artery ligation and injection of hCSCs. Upper panels: infarcted heart injected with hCSCs exposed to Fc. Over a period of 80 min, clusters of EGFP-positive hCSCs (green) are confined to the site of injection (arrowheads). Lower panels: infarcted heart injected with ephrin A1-pretreated hCSCs. Clusters of EGFP-positive hCSCs moved in the direction of the arrow over a period of 80 min. B, Solid lines reflect the displacement per hour of individual hCSCs exposed to Fc or ephrin A1. Different colors correspond to different cells. Areas included in the rectangles are shown at higher magnification in the lower panels. C, Speed of migration of hCSCs within the myocardium. *P<0.05 vs. Fc.
Figure 6
Figure 6. Ephrin A1 and myocardial regeneration
A, Myocardial scarring after infarction (collagen, white). A thin layer of spared myocytes (α-SA, red) is present in the subendocardium. The area included in the rectangle is shown at higher magnification in the inset. B and C, Band of regenerated myocardium after infarction and delivery of EGFP-labeled hCSCs exposed to Fc (B) or ephrin A1 (C); EGFP and α-SA (yellowish). The areas included in the rectangles are shown at higher magnification in the insets. D, Newly formed capillaries are positive for EGFP (green) and vWf (white). SMCs in regenerated arterioles are positive for EGFP and α-SMA (orange), and ECs for EGFP and vWf (white-green). E, hCMs are positive for EGFP (left, green) and Alu (left, white dots in nuclei), and EGFP and α-SA (right, orange). F, hCMs carry the Y-chromosome (left, Y-chr, single white dot in nuclei), and are EGFP and α-SA positive (right). G and H, Spectral analysis of hCMs positive for EGFP (G) and Alu (H). Emission spectra for EGFP (G) and Alu (H) positive hCMs are shown by the green lines, while emission spectra for tissue autofluorescence are shown by the blue lines. Note the difference in the intensity of the signals at wavelength corresponding to maximum fluorescence in each case (upper panels). Following normalization for the intensity of the signals, all emission spectra for specific labeling were essentially superimposable (lower panels). In contrast, emission spectra for tissue autofluorescence had different shapes and were easily distinguishable from specific labeling.
Figure 7
Figure 7. Ephrin A1-EphA2 system and cardiac repair
A, Number of myocytes lost and remaining after infarction in the LV of animals injected with PBS (MI), Fc-treated hCSCs (Fc) and ephrin A1-activated (ephrin A1) hCSCs. *P<0.05 vs. SO. B, Characteristics of myocytes formed by differentiation of hCSCs in hearts injected with Fc-treated and ephrin A1-treated hCSCs. C and D, Length of newly-formed resistance arterioles (C) and capillaries (D) in the regenerated myocardium after injection with Fc-or ephrin A1-treated hCSCs. E, Reduction of infarct size by tissue regeneration. L: lost myocardium; R: regenerated myocardium. *P<0.05 vs. Fc.
Figure 8
Figure 8. Ephrin A1 and functional recovery
A, Hemodynamics and echocardiographic parameters in SO, and in infarcted hearts injected with PBS (MI), Fc-treated hCSCs (Fc), and ephrin A1-treated hCSCs (ephrin A1). *,**,†P<0.05 vs. SO, MI, and Fc, respectively. B, Number of arrhythmic events in SO, and infarcted hearts injected with PBS (MI), Fc-treated hCSCs (Fc), and ephrin A1-treated hCSCs (ephrin A1). *,**P<0.05 vs. SO and MI, respectively.

References

    1. Beltrami AP, Barlucchi L, Torella D, Baker M, Limana F, Chimenti S, Kasahara H, Rota M, Musso E, Urbanek K, Leri A, Kajstura J, Nadal-Ginard B, Anversa P. Adult cardiac stem cells are multipotent and support myocardial regeneration. Cell. 2003;114:763–776. - PubMed
    1. Bearzi C, Rota M, Hosoda T, Tillmanns J, Nascimbene A, De Angelis A, Yasuzawa-Amano S, Trofimova I, Siggins RW, Lecapitaine N, Cascapera S, Beltrami AP, D'Alessandro DA, Zias E, Quaini F, Urbanek K, Michler RE, Bolli R, Kajstura J, Leri A, Anversa P. Human cardiac stem cells. Proc Natl Acad Sci USA. 2007;104:14068–14073. - PMC - PubMed
    1. Smith RR, Barile L, Cho HC, Leppo MK, Hare JM, Messina E, Giacomello A, Abraham MR, Marban E. Regenerative potential of cardiosphere-derived cells expanded from percutaneous endomyocardial biopsy specimens. Circulation. 2007;115:896–908. - PubMed
    1. Pfister O, Oikonomopoulos A, Sereti KI, Sohn RL, Cullen D, Fine GC, Mouquet F, Westerman K, Liao R. Role of the ATP-binding cassette transporter Abcg2 in the phenotype and function of cardiac side population cells. Circ Res. 2008;103:825–835. - PMC - PubMed
    1. Bergmann O, Bhardwaj RD, Bernard S, Zdunek S, Barnabe-Heider F, Walsh S, Zupicich J, Alkass K, Buchholz BA, Druid H, Jovinge S, Frisen J. Evidence for cardiomyocyte renewal in humans. Science. 2009;324:98–102. - PMC - PubMed

Publication types

MeSH terms