

Toward a global analysis of metabolites in regulatory mutants of yeast
- PMID: 21416166
- PMCID: PMC3708646
- DOI: 10.1007/s00216-011-4800-2
Toward a global analysis of metabolites in regulatory mutants of yeast
Abstract
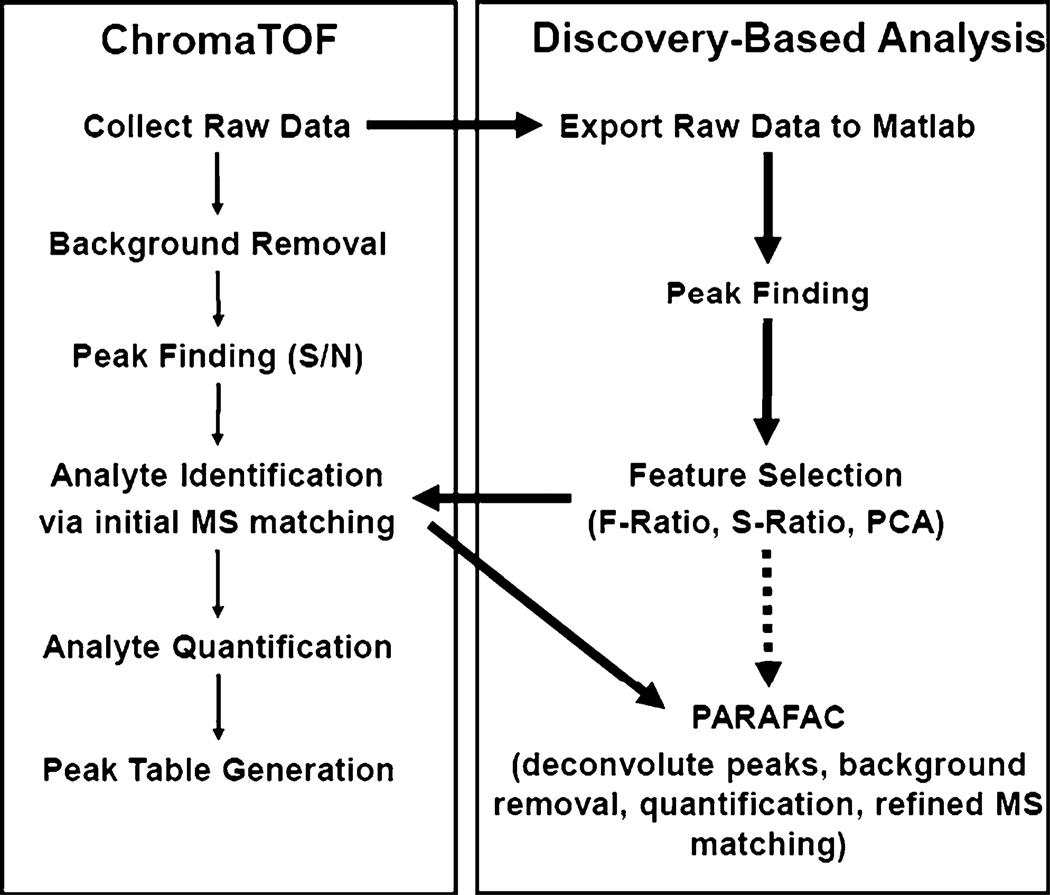
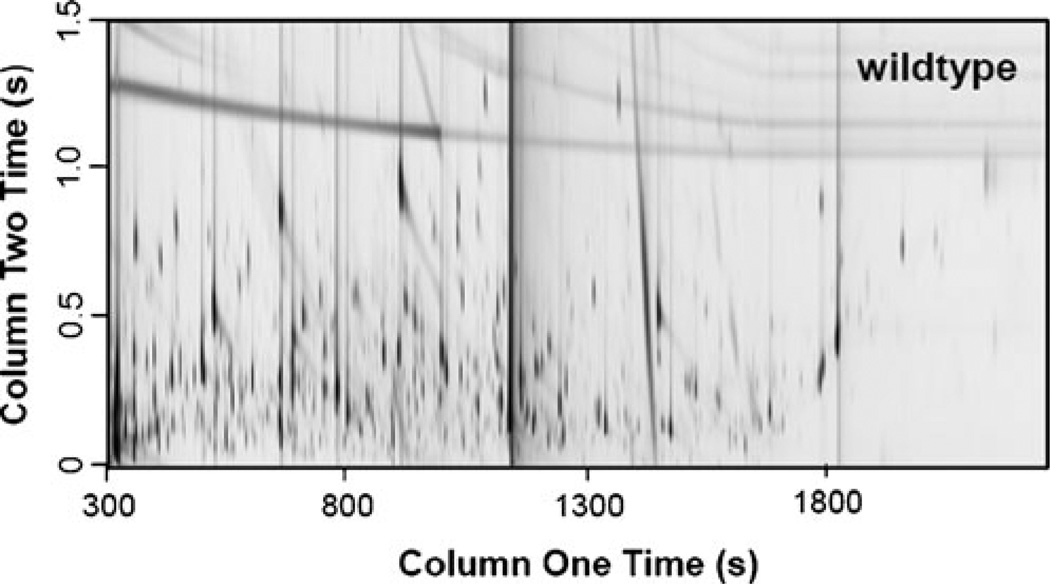
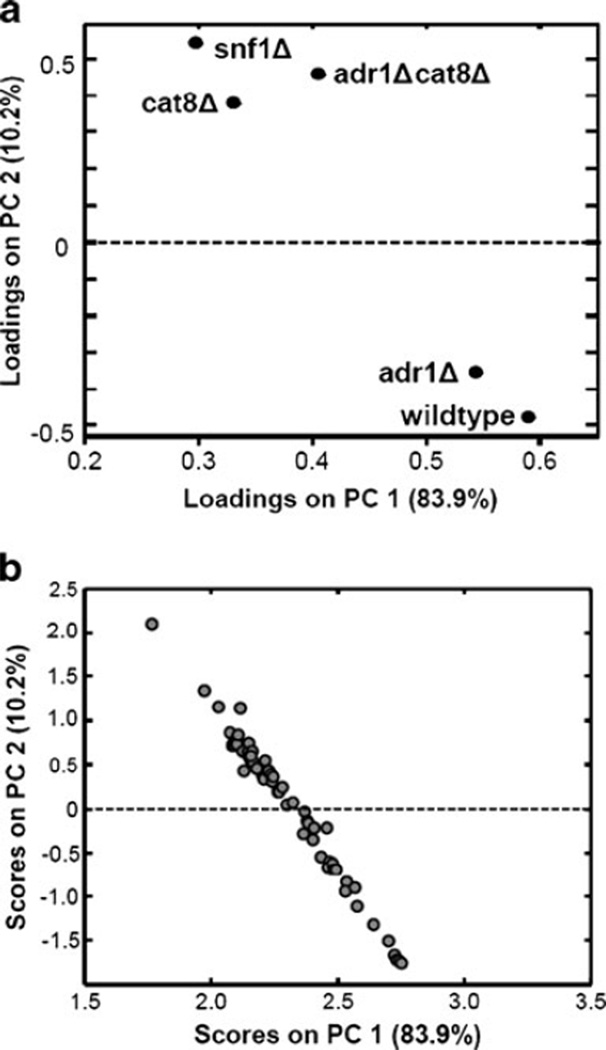
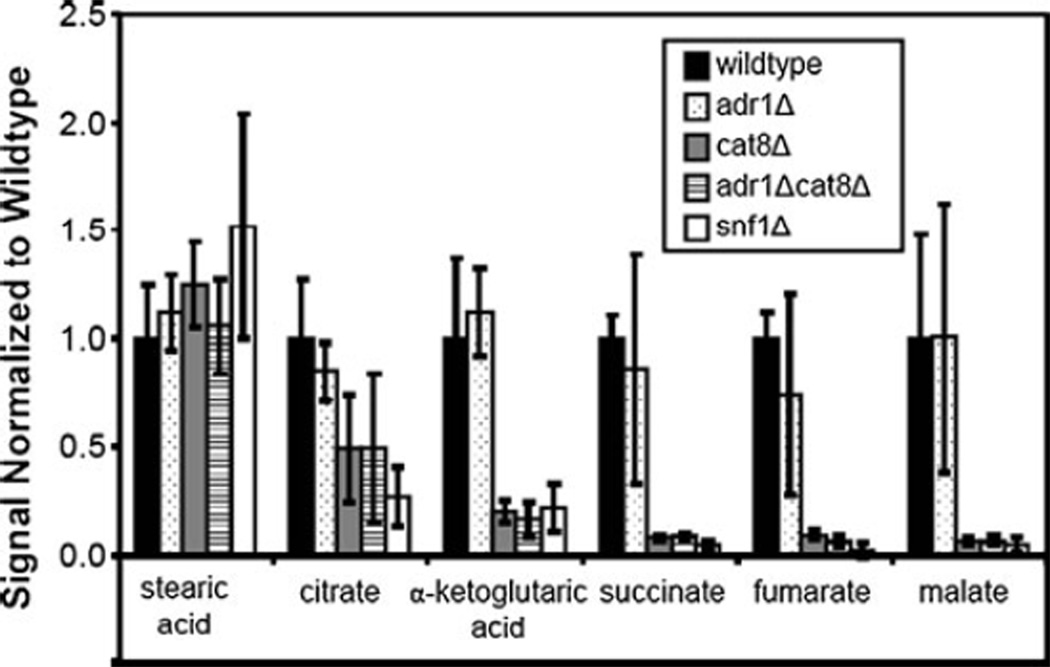
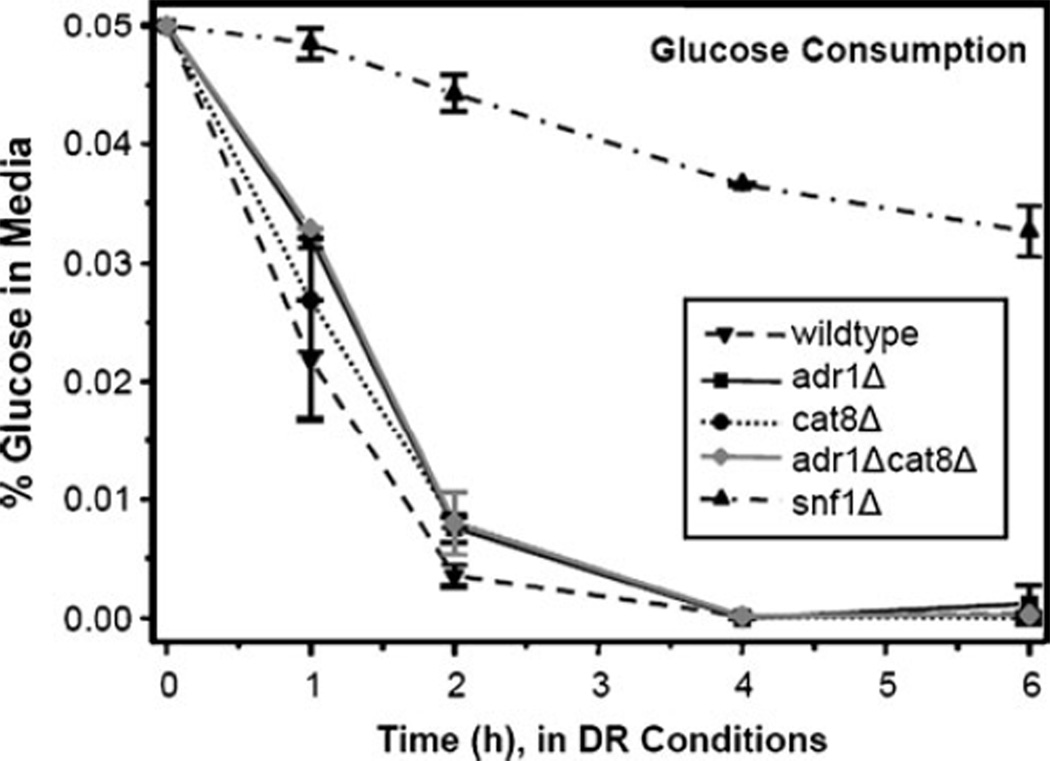
The AMP-activated protein kinase in yeast, Snf1, coordinates expression and activity of numerous intracellular signaling and developmental pathways, including those regulating cellular differentiation, response to stress, meiosis, autophagy, and the diauxic transition. Snf1 phosphorylates metabolic enzymes and transcription factors to change cellular physiology and metabolism. Adr1 and Cat8, transcription factors that activate gene expression after the diauxic transition, are regulated by Snf1; Cat8 through direct phosphorylation and Adr1 by dephosphorylation in a Snf1-dependent manner. Adr1 and Cat8 coordinately regulate numerous genes encoding enzymes of gluconeogenesis, the glyoxylate cycle, β-oxidation of fatty acids, and the utilization of alternative fermentable sugars and nonfermentable substrates. To determine the roles of Adr1, Cat8, and Snf1 in metabolism, two-dimensional gas chromatography coupled to time-of-flight mass spectrometry and liquid chromatography coupled to tandem mass spectrometry were used to identify metabolites whose levels change after the diauxic transition in wild-type-, ADR1-, CAT8-, and SNF1-deficient yeast. A discovery-based approach to data analysis utilized chemometric algorithms to identify, quantify, and compare 63 unique metabolites between wild type, adr1∆, cat8∆, adr1∆cat8∆, and snf1∆ strains. The primary metabolites found to differ were those of gluconeogenesis, the glyoxylate and tricarboxylic acid cycles, and amino acid metabolism. In general, good agreement was observed between the levels of metabolites derived from these pathways and the levels of transcripts from the same strains, suggesting that transcriptional control plays a major role in regulating the levels of metabolites after the diauxic transition.
Figures
References
-
- Goodacre R, Vaidyanathan S, Dunn WB, Harrigan GG, Kell DB. Metabolomics by numbers: acquiring and understanding global metabolite data. Trends Biotechnol. 2004;22(5):245–252. - PubMed
-
- Hollywood K, Brison DR, Goodacre R. Metabolomics: current technologies and future trends. Proteomics. 2006;6:4716–4723. - PubMed
-
- Weckwerth W, Morgenthal K. Metabolomics: from pattern recognition to biological interpretation. Drug Discov Today. 2005;10(22):1551–1558. - PubMed
-
- Dunn WB, Bailey NJ, Johnson HE. Measuring the metabolome: current analytical technologies. Analyst. 2005;130:606–625. - PubMed
-
- Dunn WB, Ellis DI. Metabolomics: current analytical platforms and methodologies. Trends Anal Chem. 2005;24(4):285–294.
Publication types
MeSH terms
Substances
Grants and funding
LinkOut - more resources
Full Text Sources
Molecular Biology Databases
