. 2011 Mar;26(3):195-201.
doi: 10.1007/s10654-011-9566-5. Epub 2011 Mar 18.

Nowcasting pandemic influenza A/H1N1 2009 hospitalizations in the Netherlands

Affiliations

Nowcasting pandemic influenza A/H1N1 2009 hospitalizations in the Netherlands

Tjibbe Donker et al. Eur J Epidemiol. 2011 Mar.

Abstract

During emerging epidemics of infectious diseases, it is vital to have up-to-date information on epidemic trends, such as incidence or health care demand, because hospitals and intensive care units have limited excess capacity. However, real-time tracking of epidemics is difficult, because of the inherent delay between onset of symptoms or hospitalizations, and reporting. We propose a robust algorithm to correct for reporting delays, using the observed distribution of reporting delays. We apply the algorithm to pandemic influenza A/H1N1 2009 hospitalizations as reported in the Netherlands. We show that the proposed algorithm is able to provide unbiased predictions of the actual number of hospitalizations in real-time during the ascent and descent of the epidemic. The real-time predictions of admissions are useful to adjust planning in hospitals to avoid exceeding their capacity.


Figures

Fig. 1
Fig. 1
Hospitalizations of confirmed pandemic influenza A/H1N1 cases during the 2009 pandemic. a Daily numbers of patients admitted between July 13 and December 30. The peak of the hospitalizations is on November 12. b The mean reporting delay over all cases up to the indicated date of admission. c The frequency distribution of the admission-to-reporting delay. d The normalized cumulative delay distribution. The dotted line indicates the threshold level of 0.95 for the reporting horizon, the dashed line indicates that after 14  days more than 95% of the hospitalizations has been reported
Fig. 2
Fig. 2
Correcting for the reporting delay on October 28 (left) and December 2 (right). Top panels the reported number of patients admitted to hospital with confirmed influenza A/H1N1 at each of the dates. Middle panels the probability of having been reported, as a function of admission date. The dotted line shows the 95% threshold, used for the reporting horizon (dashed line). Bottom panels The estimated number of cases (red line), including 1/6.8 likelihood support (red shaded area) and 95% reporting horizon (yellow-black dashed line). The black line denotes the final number of cases, reported until December 30. The initial number of cases shows a decline on both dates, but the compensation shows that the number of hospitalized patients is still increasing on the first date. (Color figure online)
Fig. 3
Fig. 3
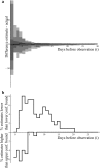
Accuracy of the estimates. a Distribution of the difference between the estimated and actual number of admitted patients as a function of the time between the admission and observation, measured as a moving window over the entire epidemic. The solid black line shows the median, the shaded areas show the total range, 95% of the data (between the 2.5 and 97.5% percentile), and 75% of the data (between the 12.5 and 87.5% percentile). b The percentage of estimations where the actual number of cases was below the lower or above the upper confidence bound
Fig. 4
Fig. 4
Differences between weekdays. a Total number of hospitalizations (dark grey) and incoming reports (light grey) by weekday. Only 8 reports were filed during the weekends. b The mean (and 95%CI) reporting delay for each weekday. Delays are longest on Thursday and Friday, and shortest on Sunday and Monday
Fig. 5
Fig. 5
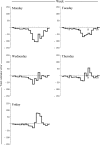
Total difference between estimated and actual number of admitted patients over the entire time period, excluding the day of observation (0 days delay), and split up be weekday of observation. The results of the estimator clearly shifts during the week, with the best estimations on Wednesday

Similar articles

Cited by

References

    1. Fraser C, Donnelly CA, Cauchemez S, Hanage WP, Van Kerkhove MD, Hollingsworth TD, et al. Pandemic potential of a strain of influenza A (H1N1): early findings. Science. 2009;324(5934):1557–61. doi: 10.1126/science.1176062. - DOI - PMC - PubMed
    1. Presanis AM, De Angelis D, Hagy A, Reed C, Riley S, Cooper BS, et al. The severity of pandemic H1N1 influenza in the United States, from April to July 2009: a Bayesian analysis. PLoS Med. 2009;6(12):e1000207. doi: 10.1371/journal.pmed.1000207. - DOI - PMC - PubMed
    1. Wu JT, Cowling BJ, Lau EHY, Ip DKM, Ho LM, Tsang T, et al. School closure and mitigation of pandemic (H1N1) 2009, Hong Kong. Emer Infect Dis. 2010;16(3):538–41. - PMC - PubMed
    1. Domínguez-Cherit G, Lapinsky SE, Macias AE, Pinto R, Espinosa-Perez L, de la Torre A, et al. Critically Ill patients with 2009 influenza A(H1N1) in Mexico. JAMA. 2009;302(17):1880–7. doi: 10.1001/jama.2009.1536. - DOI - PubMed
    1. Kumar A, Zarychanski R, Pinto R, Cook DJ, Marshall J, Lacroix J, et al. Critically ill patients with 2009 influenza A(H1N1) infection in Canada. JAMA. 2009;302(17):1872–9. doi: 10.1001/jama.2009.1496. - DOI - PubMed