. 2011 Aug;100(8):3396-3404.
doi: 10.1002/jps.22527. Epub 2011 Mar 17.

Impact of autoclave sterilization on the activity and structure of formulated heparin

Affiliations

Impact of autoclave sterilization on the activity and structure of formulated heparin

Julie M Beaudet et al. J Pharm Sci. 2011 Aug.

Abstract

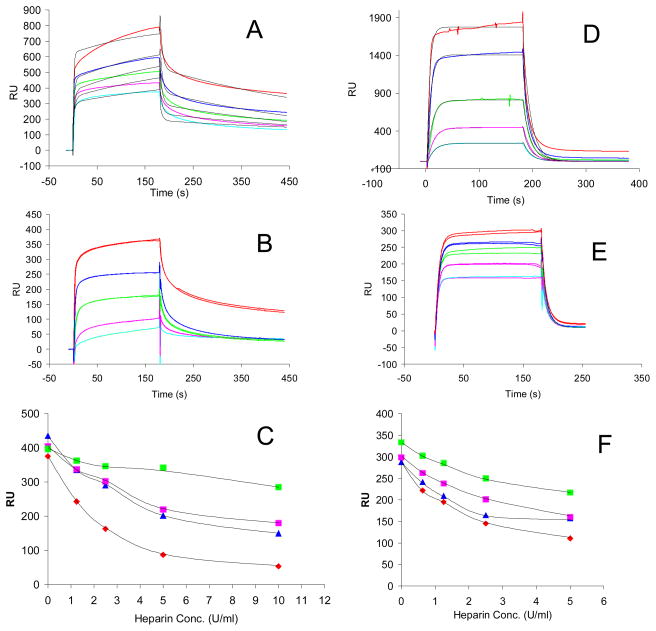
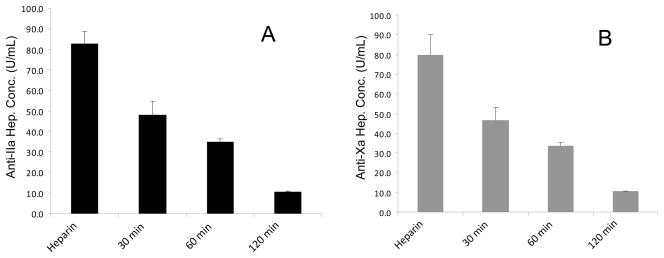
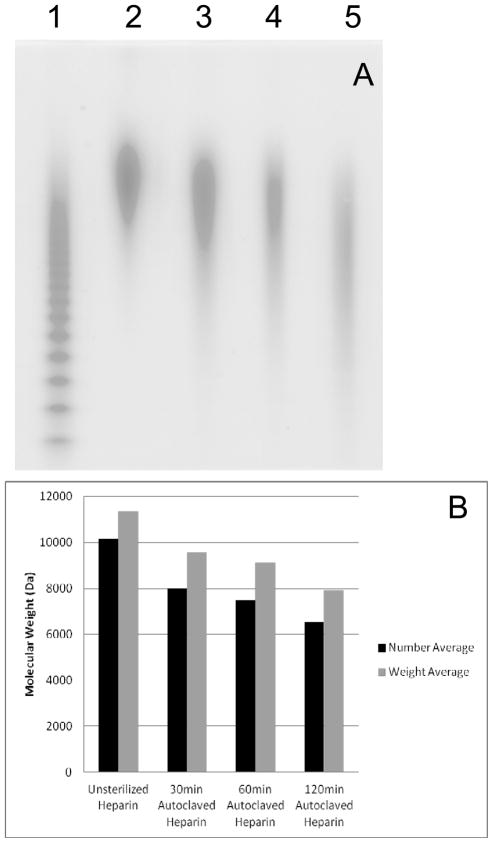
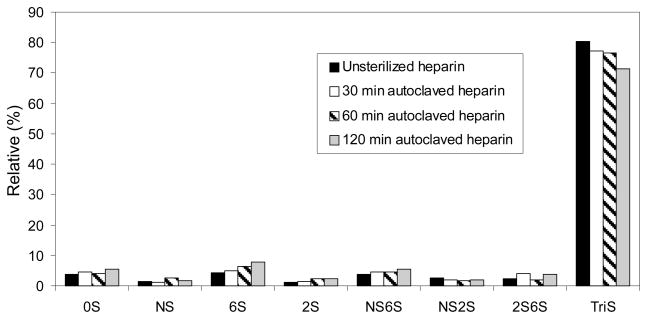
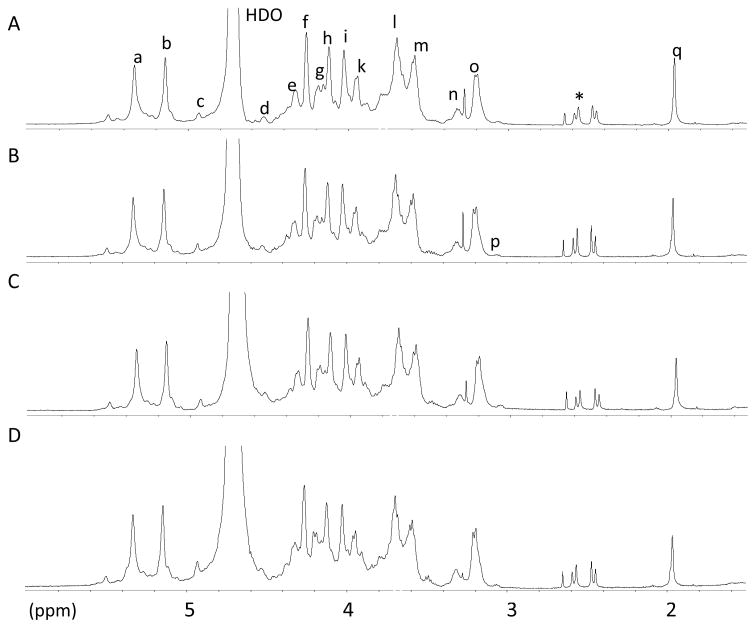
The stability of a formulated heparin was examined during its sterilization by autoclaving. A new method to follow loss in heparin binding to the serine protease inhibitor, antithrombin III, and the serine protease, thrombin, was developed using a surface plasmon resonance competitive binding assay. This loss in binding affinity correlated well with loss in antifactor IIa (thrombin) activity as well as antifactor Xa activity as measured using conventional amidolytic assays. Autoclaving also resulted in a modest breakdown of the heparin backbone as confirmed by a slight reduction in number-averaged and weight-averaged molecular weight and an increase in polydispersity. Although no clear changes were observed by nuclear magnetic resonance spectroscopy, disaccharide composition analysis using high-performance liquid chromatography-electrospray ionization-mass spectrometry suggested that loss of selected sulfo groups had taken place. It is this sulfo group loss that probably accounts for a decrease in the binding of autoclaved heparin to antithrombin III and thrombin as well as the observed decrease in its amidolytic activity.


Figures

Fig. 1
Fig. 1
SPR sensorgrams of AT III-heparin and human thrombin-heparin interaction and IC50 measurement of heparin product with different autoclaving time using surface competition SPR. Panel A. Sensorgrams of heparin-AT III interactions. Concentrations of AT III (from top to bottom): 1000, 500, 250, 125, and 63 nM, respectively. The black curves in all sensorgrams are the fitting curves using models from BIAevaluate 4.0.1. Panel B. Competition SPR sensorgrams of AT III-heparin interaction (solution heparin/surface heparin competition). AT III concentration was 250nM, and concentrations of heparin in solution (from top to bottom) were 0,1.25, 2.5, 5, 10 U/ml, respectively; Panel C. IC50 measurement of heparin product with different autoclaving time to AT III using surface competition SPR. Color code: red: non-sterilized heparin, blue: 30 min sterilized heparin, pink: 60 min sterilized heparin, and green: 120 min sterilized heparin. Panel D. Sensorgrams of heparin-human factor IIa (thrombin) interactions. Concentrations of human thrombin (from top to bottom): 1000, 500, 250, 125, and 63 nM, respectively. The black curves in all sensorgrams are the fitting curves using models from BIAevaluate 4.0.1. Panel E. Competition SPR sensorgrams of human thrombin-heparin interaction (solution heparin/surface heparin competition). Human thrombin concentration was 125nM, and concentrations of heparin in solution (from top to bottom) were 0, 0.63, 1.25, 2.5, 5 U/ml, respectively; Panel F. IC50 measurement of heparin product with different autoclaving time to human thrombin using surface competition SPR. Color code: red: non-sterilized heparin, blue: 30 min sterilized heparin, pink: 60 min sterilized heparin, and green: 120 min sterilized heparin.
Fig. 2
Fig. 2
Anti-IIa and Anti-Xa assay on heparin product with different autoclaving time. Panel A: Anti-IIa assay; Panel B: Anti-Xa assay
Fig. 3
Fig. 3
PAGE analysis of heparin product with different autoclaving time. A. Lane 1, HP oligosaccharide standards; lane 2 to 4: non-sterilized heparin, 30 min sterilized heparin, 60 min sterilized Heparin, and 120 min sterilized heparin. B. Molecular weight change of heparin product with different autoclaving time. The PD values for the four samples were 1.15, 1.16, 1.20, 1.22, respectively.
Fig. 4
Fig. 4
Disaccharide compositional analysis of heparin product with different autoclaving time
Fig. 5
Fig. 5
600 MHz 1H-NMR spectra of non-sterilized heparin (A), 30 min sterilized heparin (B), 60 min sterilized heparin (C), 120 min sterilized heparin (D) recorded in D20 at 298 K. Signals, a, H1 GlcNS, GlcNS6S; b, H1 IdoA2S; c, H1 IdoA; d, H1 GlcA; e, H6 GlcNS6S; f, H2 Ido2S; g, H6′ GlcNS6S; h, H3 IdoA2S; i, H4 IdoA2S; j, H5 GlcNS6S; k, H6 GlcNS; l, H4 GlcNS6S; m, H3 GlcNS, GlcNS6S; n, H2 GlcA; o, H2 GlcNS6S; p, H2 GlcNH2; q, acetyl CH3; Asterisks shows undefined peaks.

References

    1. Linhardt RJ. Heparin: Structure and activity. J Med Chem. 2003;46:2551–2554. - PubMed
    1. Jandik KA, Kruep D, Cartier M, Linhardt RJ. Accelerated stability studies of heparin. J Pharm Sci. 1996;85:45–51. - PubMed
    1. Patel RP, Narkowicz C, Jacobson GA. Investigation of the effect of heating on the chemistry and antifactor Xa activity of Enopaparin. J Pharm Sci. 2009;98:1700–1711. - PubMed
    1. Hernaiz M, Liu J, Rosenberg RD, Linhardt RJ. Enzymatic modification of heparan sulfate on a biochip promotes its interaction with antithrombin III. Biochem Biophys Res Commun. 2000;276:292–297. - PubMed
    1. Mousa SA, Zhang F, Aljada A, Chaturvedi S, Takieddin M, Zhang H, Chi L, Arbit E, Castelli MC, Goldberg MM, Linhardt RJ. Pharmacokinetics and pharmacodynamics of oral heparin solid dosage form in healthy human subjects. Journal of Clinical Pharmacology. 2007;47:1508–1520. - PMC - PubMed

Publication types