

Disparities in stroke incidence contributing to disparities in stroke mortality
- PMID: 21416498
- PMCID: PMC3595534
- DOI: 10.1002/ana.22385
Disparities in stroke incidence contributing to disparities in stroke mortality
Abstract
Objective: While black-white and regional disparities in U.S. stroke mortality rates are well documented, the contribution of disparities in stroke incidence is unknown. We provide national estimates of stroke incidence by race and region, contrasting these to publicly available stroke mortality data.
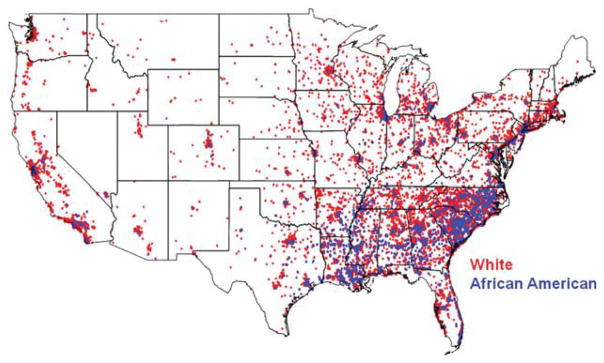
Methods: This analysis included 27,744 men and women without prevalent stroke (40.4% black), aged ≥45 years from the REasons for Geographic And Racial Differences in Stroke (REGARDS) national cohort study, enrolled 2003-2007. Incident stroke was defined as first occurrence of stroke over 4.4 years of follow-up. Age-sex-adjusted stroke mortality rates were calculated using data from the Centers for Disease Control and Prevention (CDC) Wide-Ranging Online Data for Epidemiological Research (WONDER) System.
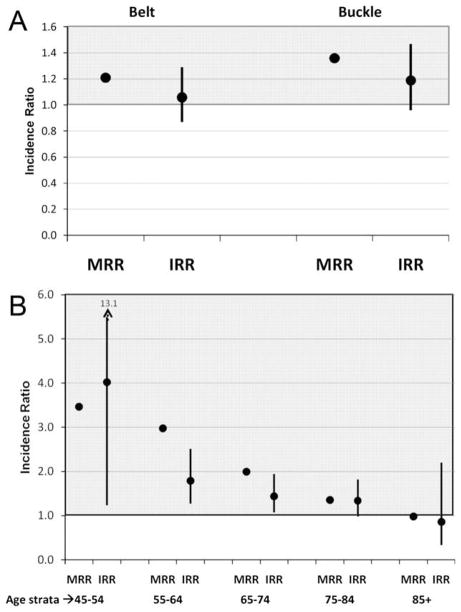
Results: There were 460 incident strokes over 113,469 person-years of follow-up. Relative to the rest of the United States, incidence rate ratios (IRRs) of stroke in the southeastern stroke belt and stroke buckle were 1.06 (95% confidence interval [CI], 0.87-1.29) and 1.19 (95% CI, 0.96-1.47), respectively. The age-sex-adjusted black/white IRR(black) was 1.51 (95% CI, 1.26-1.81), but for ages 45-54 years the IRR(black) was 4.02 (95% CI, 1.23-13.11) while for ages 85+ it was 0.86 (95% CI, 0.33-2.20). Generally, the IRRs(black) were less than the mortality rate ratios (MRRs) across age groups; however, only in ages 55-64 years and 65-74 years did the 95% CIs of IRRs(black) not include the MRR(black) . The MRRs for regions were within 95% CIs for IRRs.
Interpretation: National patterns of black-white and regional differences in stroke incidence are similar to those for stroke mortality; however, the magnitude of differences in incidence appear smaller.
Copyright © 2011 American Neurological Association.
Conflict of interest statement
D.R., G.H., and V.J.H. have received grant(s) from the NIH National Institute of Neurological Disorders and Stroke (NINDS) for the REGARDS Study. G.H. has grant(s) pending from the NIH-NINDS. B.K. has received funding from NIH-NINDS for the REGARDS study for travel to study meetings, effort for adjudication of stroke events, and authorship; has grant(s) pending (NINDS R-01 NS039987, NCRR 1UL1 RR026314); has consulted for Allergan; has developed educational presentations for and has been paid for travel from Allergan; and has provided expert testimony for various entities. D.O.K. has been paid travel expenses for meetings from NINDS REGARDS funding; has been paid for lectures from the Boehringer Ingelheim Speaker’s Bureau; and has grant(s) pending from NINDS. M.C. has received grant(s) from the NIH and has been reimbursed travel expenses for meetings from the NIH. L.M. has received grant(s), has grant(s) pending, and has received consulting fees (as a DSMB member) from NINDS. S.J. has received grant(s) and has received support for travel to meetings from NIH-NINDS.
Figures
Comment in
-
Assessing stroke incidence and mortality across the United States.Ann Neurol. 2011 Apr;69(4):595-6. doi: 10.1002/ana.22437. Ann Neurol. 2011. PMID: 21520227 No abstract available.
References
-
- Centers for Disease Control and Prevention. Ten great public health achievements–United States, 1900–1999. MMWR Morb Mortal Wkly Rep. 1999;48:241–243. - PubMed
-
- Howard G, Anderson R, Sorlie P, et al. Ethnic differences in stroke mortality between non-Hispanic whites, Hispanic whites, and blacks. The National Longitudinal Mortality Study. Stroke. 1994;25:2120–2125. - PubMed
-
- Gillum RF. Stroke mortality in blacks. Disturbing trends. Stroke. 1999;30:1711–1715. - PubMed
-
- Howard G, Howard VJ. Ethnic disparities in stroke: the scope of the problem. Ethn Dis. 2001;11:761–768. - PubMed
-
- Towfighi A, Ovbiagele B, Saver JL. Therapeutic milestone: stroke declines from the second to the third leading organ- and disease-specific cause of death in the United States. Stroke. 2010;41:499–503. - PubMed
Publication types
MeSH terms
Grants and funding
LinkOut - more resources
Full Text Sources
Other Literature Sources
Medical
