. 2012 Feb;33(2):455-65.
doi: 10.1002/hbm.21223. Epub 2011 Mar 17.

Individual variability in the shape and amplitude of the BOLD-HRF correlates with endogenous GABAergic inhibition

Affiliations

Individual variability in the shape and amplitude of the BOLD-HRF correlates with endogenous GABAergic inhibition

Suresh D Muthukumaraswamy et al. Hum Brain Mapp. 2012 Feb.

Abstract

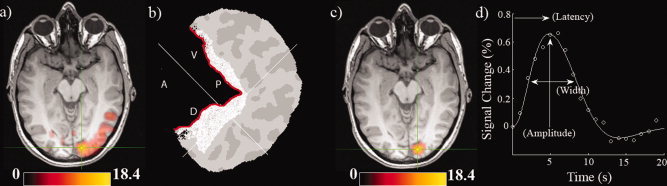
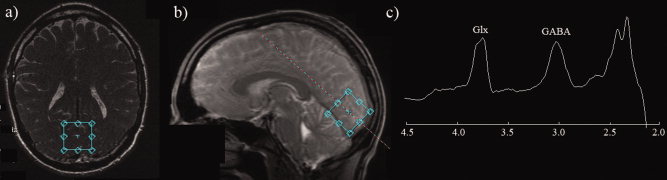
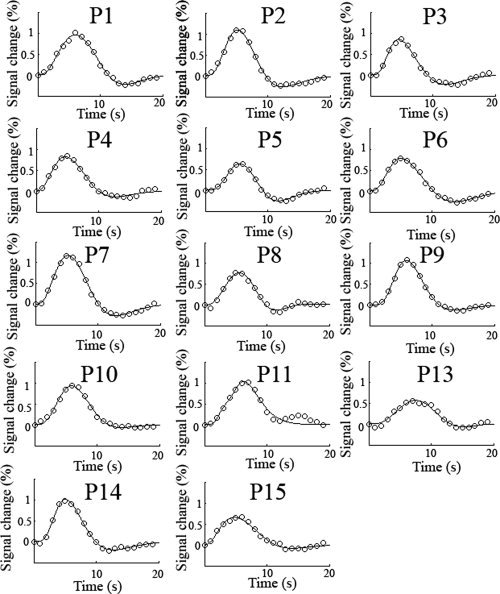
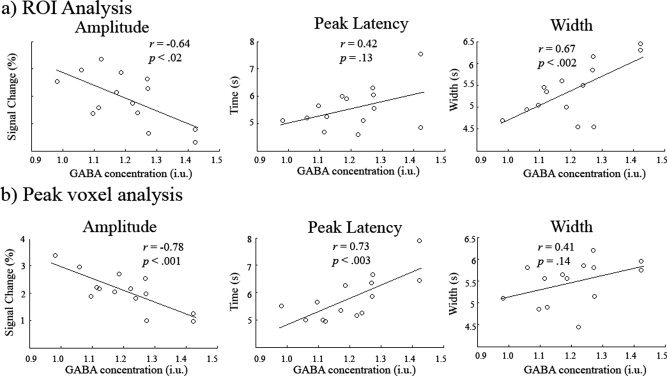
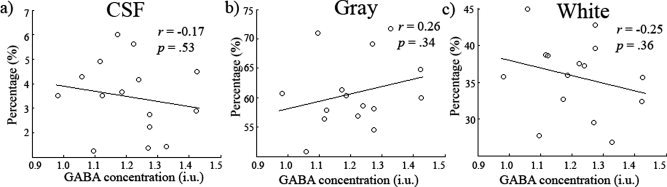
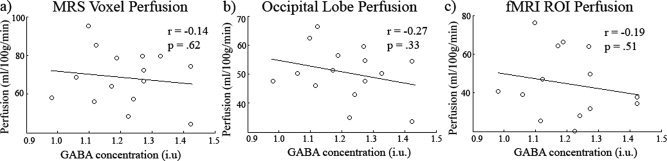
It has previously been demonstrated that there is a negative correlation between the amplitude of the BOLD response and resting γ amino-butyric acid (GABA) concentration in visual cortex. The work here is the first to empirically characterize individual variability in the haemodynamic response functions (HRFs) in response to a simple visual stimulus and baseline GABA concentration in a population of young adult males (n = 15, aged 20-28 years). The results demonstrate that GABA concentration is negatively correlated with BOLD response amplitude (r = -0.64, P < 0.02) and positively correlated with HRF width (r = 0.67, P < 0.002), that is, individuals with higher resting GABA concentration tend to exhibit smaller and wider HRFs. No correlations were observed with resting cerebral blood flow and GABA concentration and similarly, no correlations were observed between GABA and the proportional tissue content of the MRS voxel. We argue that correlation of the height of the HRF is supportive of the view that the previously observed correlations between BOLD amplitudes and GABA are reflective of differences in neuronal activity. However, the changes in HRF shape in individuals with higher baseline GABA levels are suggestive that differing vascular response characteristics may also make a significant contribution. Our results reinforce the view that variability in endogenous factors, such as neurotransmitter concentration, can have a profound effect on the vascular haemodynamic response. This has important implications for between-cohort fMRI studies in which variation in parameters such as GABA concentration may lead to group differences in the BOLD signal.


Figures

Figure 1
Figure 1
(a) BOLD activation map from Participant 1 (P < 0.05, voxel corrected). Units are z scores. (b) Freesurfer flatmap representation of the right hemisphere posterior occipital cortex of Participant 1. The flatmap has been opened up along the calcarine sulcus (indicated in red). The anatomical region of interest is shaded in white and the white crosshair indicates the peak activation voxel in the fMRI map. Anatomical directions of the calcarine are indicated (A = Anterior, P = Posterior, V = Ventral, D = Dorsal). (c) Similar activation map as (a) after the anatomical mask has been applied. (d) The empirical HRF derived from the activation ROI in (c) along with the fitted function. A schematic of how parameters of amplitude, latency, and width were obtained is included. [Color figure can be viewed in the online issue, which is available at wileyonlinelibrary.com.]
Figure 2
Figure 2
(a,b) Typical location of the 3 × 3 × 3 cm spectroscopy voxel for oblique‐axial and sagittal slices placed on the localiser scan (c) A typical GABA‐edited spectrum obtained from a single acquisition/participant (two spectra were obtained for each participant). A clearly resolved GABA peak is evident at 3 ppm. [Color figure can be viewed in the online issue, which is available at wileyonlinelibrary.com.]
Figure 3
Figure 3
Experimentally obtained HRFs from the activation ROI for each participant along with the fitted function. HRFs from the peak voxel location can be found in the Supporting Information. The TR was 1 s. Clear HRFs are present for each participant although significant variability can seen visually in the amplitude and shape of the HRF as they all share the same axis scaling. P12 was excluded from the fMRI analysis due to excessive head motion.
Figure 4
Figure 4
Scatter plots showing the correlation of HRF amplitude, peak latency and width (FWHM of the peak) with GABA concentration for the ROI analysis (a) and for the peak voxel (b). In both cases amplitude was negatively correlated with GABA concentration. Confidence intervals for the r values can be found in the Results.
Figure 5
Figure 5
(a, b) shows the location of the spectroscopy voxel on the 1 mm FSPGR scan. The results of the FAST segmentation are displayed with gray matter marked in brown, white matter in tan and CSF in green. For the empirical analysis partial volume estimates were used (c) Across group mean proportion of tissue types as calculated from the fractional probability percentages returned by FAST. Error bars represent the standard deviation (see text for numbers). [Color figure can be viewed in the online issue, which is available at wileyonlinelibrary.com.]
Figure 6
Figure 6
(ac) Scatter plots showing GABA concentration (i.u) against CSF, gray and white matter respectively. No relationship was found between any of the tissue types and GABA concentration. Confidence intervals for the r values can be found in the results.
Figure 7
Figure 7
Scatter plot showing GABA versus (a) MRS voxel gray matter perfusion, (b) occipital lobe gray matter perfusion, and (c) fMRI ROI gray matter. No significant relationships were found. See text for confidence intervals of the r values. The perfusion measures were intercorrelated.

References

    1. Aguirre GK, Zarahn E, D'Esposito M ( 1998): The variability of human, BOLD hemodynamic responses Neuroimage 8: 360–369. - PubMed
    1. Bachtiar V, Stagg C, Johansen‐Berg H ( 2010): GABAergic tone and its responsiveness to modulation reflect individual performance of motor tasks. Presented at the 16th Annual Meeting of the Organization for Human Brain Mapping, Barcelona.
    1. Bernard C, Cossart R, Hirsch JC, Esclapez M, Ben‐Ari Y ( 2000): What is GABAergic inhibition? How is it modified in epilepsy? Epilepsia 41: S90–S95. - PubMed
    1. Brown GG, Eyler Zorrilla LT, Georgy B, Kindermann SS, Wong EC, Buxton RB ( 2003): BOLD and perfusion response to finger‐thumb apposition after acetazolamide administration: Differential relationship to global perfusion. J Cereb Blood Flow Metab 23: 829–837. - PubMed
    1. Buzsaki G, Kaila K, Raichle M ( 2007): Inhibition and brain work. Neuron 56: 771–783. - PMC - PubMed

Publication types

Substances