Multicenter Study
. 2012 Apr;33(4):938-57.
doi: 10.1002/hbm.21261. Epub 2011 Mar 17.

Creating probabilistic maps of the face network in the adolescent brain: a multicentre functional MRI study

Collaborators, Affiliations
Multicenter Study

Creating probabilistic maps of the face network in the adolescent brain: a multicentre functional MRI study

Amir M Tahmasebi et al. Hum Brain Mapp. 2012 Apr.

Abstract

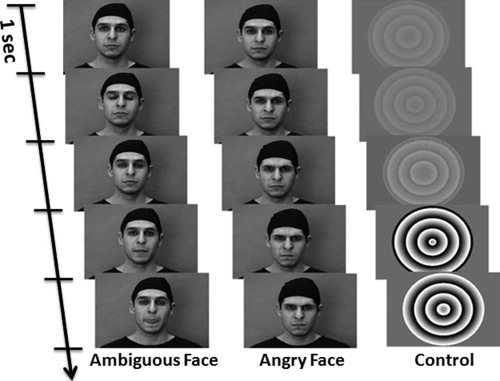
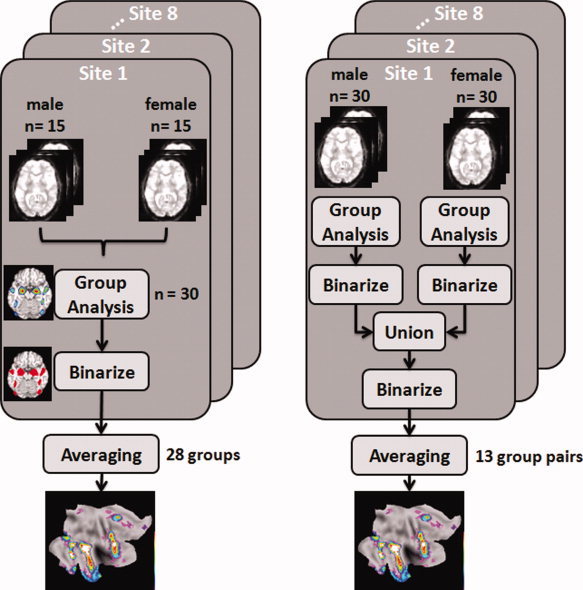
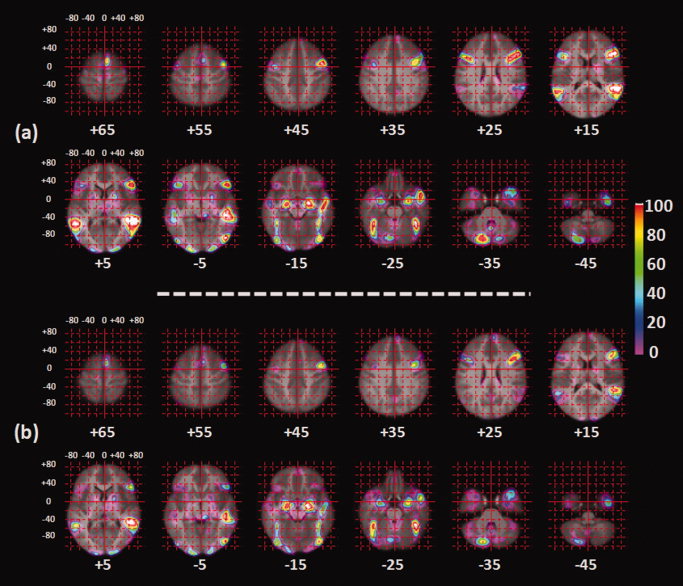
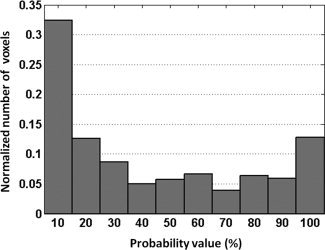
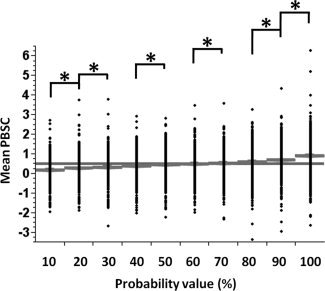
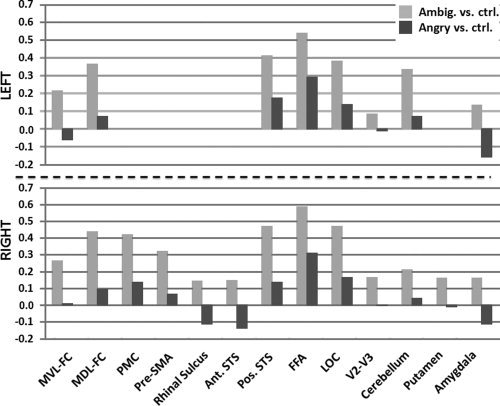
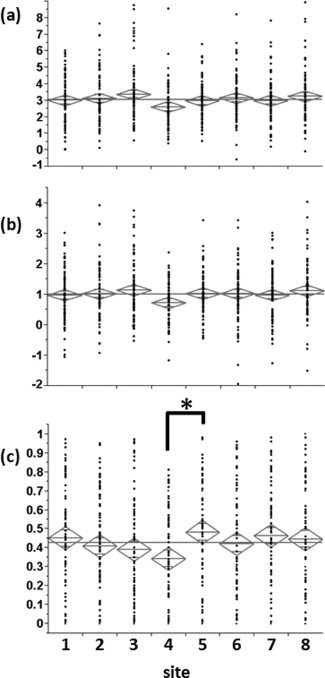
Large-scale magnetic resonance (MR) studies of the human brain offer unique opportunities for identifying genetic and environmental factors shaping the human brain. Here, we describe a dataset collected in the context of a multi-centre study of the adolescent brain, namely the IMAGEN Study. We focus on one of the functional paradigms included in the project to probe the brain network underlying processing of ambiguous and angry faces. Using functional MR (fMRI) data collected in 1,110 adolescents, we constructed probabilistic maps of the neural network engaged consistently while viewing the ambiguous or angry faces; 21 brain regions responding to faces with high probability were identified. We were also able to address several methodological issues, including the minimal sample size yielding a stable location of a test region, namely the fusiform face area (FFA), as well as the effect of acquisition site (eight sites) and scanner (four manufacturers) on the location and magnitude of the fMRI response to faces in the FFA. Finally, we provided a comparison between male and female adolescents in terms of the effect sizes of sex differences in brain response to the ambiguous and angry faces in the 21 regions of interest. Overall, we found a stronger neural response to the ambiguous faces in several cortical regions, including the fusiform face area, in female (vs. male) adolescents, and a slightly stronger response to the angry faces in the amygdala of male (vs. female) adolescents.


Figures

Figure 1
Figure 1
Stimuli presentation: Snapshots were taken at the beginning (initial one second) of representative clips of each condition. The video clips were displayed at 30 frames/s. Two consecutive images on the figure are separated by five frames.
Figure 2
Figure 2
Flowchart illustration of the procedure for creating two types of functional probabilistic maps using functional data from eight acquisition sites: Left: sex combined at entry; and Right: sex combined after sex‐specific analyses.
Figure 3
Figure 3
Axial cross‐sections of the probability maps of the (a) ambiguous and (b) angry contrasts between the face and control stimuli superimposed on the average image generated using 840 warped structural images of the participants who contributed to the probability maps. Numbers below the images correspond to the Z coordinates.
Figure 4
Figure 4
Probability maps of the ambiguous (a) and angry (b) contrasts between the face and control stimuli displayed of the flatten cerebral cortex. The bottom image (c) provides reference to the location of the main cortical regions responding to the presentation of faces, including: FFA, fusiform face area; LOC, lateral occipital cortex; STS, superior temporal sulcus; preSMA, pre supplementary motor area; PMC, premotor cortex; MDL‐FC, mid dorsolateral frontal cortex; and MVL‐FC, mid ventrolateral frontal cortex. Left and right hemispheres are displayed on the left and right, respectively.
Figure 5
Figure 5
Distribution of the number of voxels (normalized between 0 and 1) with respect to the probability values of the right FFA.
Figure 6
Figure 6
Distribution of the number of voxels (normalized between 0 and 1) with respect to the probability values of the right amygdala.
Figure 7
Figure 7
Distribution of the peak BOLD response (first column), mean BOLD response (second column) and the number of active voxels (third column) in a region‐of‐interest around the right FFA, which was extracted from the probability map for the ambiguous face vs. control stimulus contrast. The four rows display the three measures obtained, with the aid of the probabilistic map, in the following four ways: (a) all voxels with all range of probability values (i.e., 1 to 100%); (b) high probability voxels (i.e., 51 to 100%); (c) low probability voxels (i.e., 1 to 50%); and (d) similar to (a) except that voxel measure is weighted by the corresponding probability value at each voxel. The median of each distribution is shown with a solid black line in each plot.
Figure 8
Figure 8
Distribution of the peak BOLD response (first column), mean BOLD response (second column) and the number of active voxels (third column) in a region‐of‐interest around the right amygdala, which was extracted from the probability map for the ambiguous face vs. control stimulus contrast. The four rows display the three measures obtained, with the aid of the probabilistic map, in the following four ways: (a) all voxels with all range of probability values (i.e., 1 to 100%); (b) high probability voxels (i.e., 51 to 100%); (c) low probability voxels (i.e., 1 to 50%); and (d) similar to (a) except that voxel measure is weighted by the corresponding probability value at each voxel. The median of each distribution is shown with a solid black line in each plot.
Figure 9
Figure 9
Frequency of the location (top) and the value (bottom) of the peak voxel in the right fusiform face area, which was extracted from the probability map for the ambiguous face vs. control stimulus contrast, as a function of its probability. The gray line presents the mean of the peak PBSC within the population.
Figure 10
Figure 10
Frequency of the location (top) and the value (bottom) of the peak voxel in the right amygdala, which was extracted from the probability map for the ambiguous face vs. control stimulus contrast, as a function of its probability. The gray line presents the mean of the peak PBSC within the population.
Figure 11
Figure 11
Distribution of the mean PBSC with respect to the threshold value extracted from the probability map for the ambiguous face vs. control stimulus contrast for the region of right FFA. (*) indicates a significant difference in post hoc comparisons. The gray line presents the group mean PBSC.
Figure 12
Figure 12
Distribution of the mean PBSC with respect to the threshold value extracted from the probability map for the ambiguous face vs. control stimulus contrast for the region of right amygdala. (*) indicates a significant difference in post hoc comparisons. The gray line presents the group mean PBSC.
Figure 13
Figure 13
Sex differences (Cohen's d; 592 girls, 518 boys) in the number of active voxels within 21 ROIs of the PM13. Positive and negative values represent higher number of active voxels for girls than boys and vice versa.
Figure 14
Figure 14
Euclidean distances for the different sample sizes (from 10 to 80 participants) calculated across the eight acquisition sites per sample. For each sample, we calculated the distance between the location of the right fusiform face area (FFA) obtained in this sample and its “reference” location. The “reference” location of the right FFA was defined as the median across the eight acquisition sites for the largest sample size of 80 participants (MNI coordinate: X = +42, Y = −48, Z = −23).
Figure 15
Figure 15
Functional MR response to ambiguous faces in the right fusiform face area. (a) Peak percent BOLD signal change; (b) mean percent BOLD signal change; and (c) normalized number of active voxels. Site indicates the eight acquisition sites (in no particular order). (*) indicates a significant difference in post hoc comparisons.

References

    1. Adolphs R ( 2008): Fear, faces, and the human amygdala. Curr Opin Neurobiol 18: 166–172. - PMC - PubMed
    1. Akiyama T, Kato M, Muramatsu T, Saito F, Umeda S, Kashima H ( 2006): Gaze but not arrows: A dissociative impairment after right superior temporal gyrus damage. Neuropsychologia 44: 1804–1810. - PubMed
    1. Aleman A, Swart M ( 2008): Sex differences in neural activation to facial expressions denoting contempt and disgust. PLoS One 3: e3622. - PMC - PubMed
    1. Beauchamp MS, Lee KE, Haxby JV, Martin A ( 2003): FMRI responses to video and point‐light displays of moving humans and manipulable objects. J Cogn Neurosci 15: 991–1001. - PubMed
    1. Benton A ( 1990): Facial recognition. Cortex 26: 491–499. - PubMed

Publication types