

10,000-fold concentration increase of the biomarker cardiac troponin I in a reducing union microfluidic chip using cationic isotachophoresis
- PMID: 21416810
- PMCID: PMC3289062
- DOI: 10.1039/c0lc00490a
10,000-fold concentration increase of the biomarker cardiac troponin I in a reducing union microfluidic chip using cationic isotachophoresis
Abstract
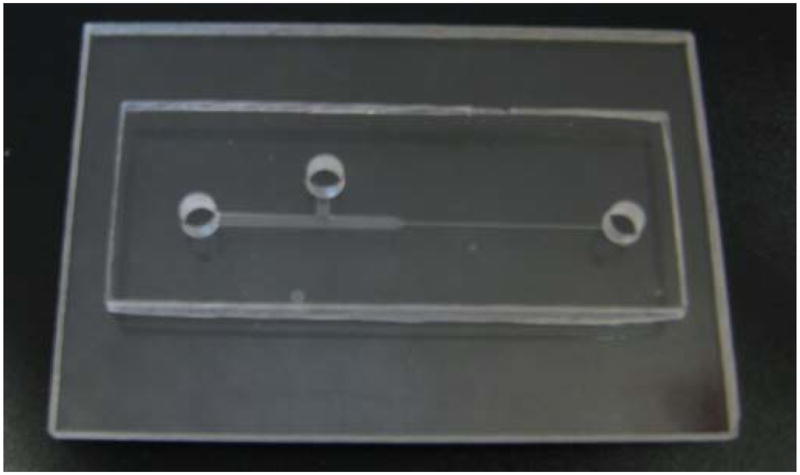
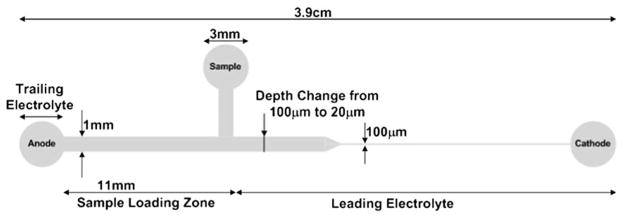
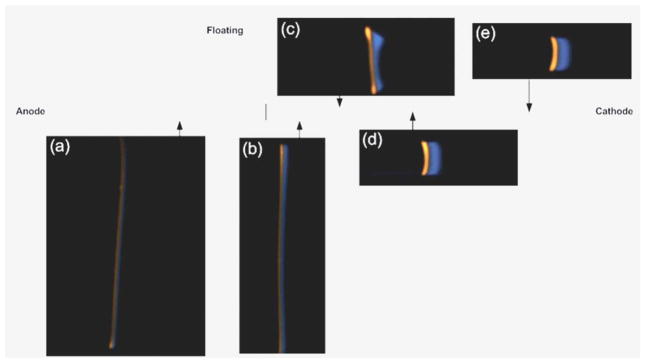
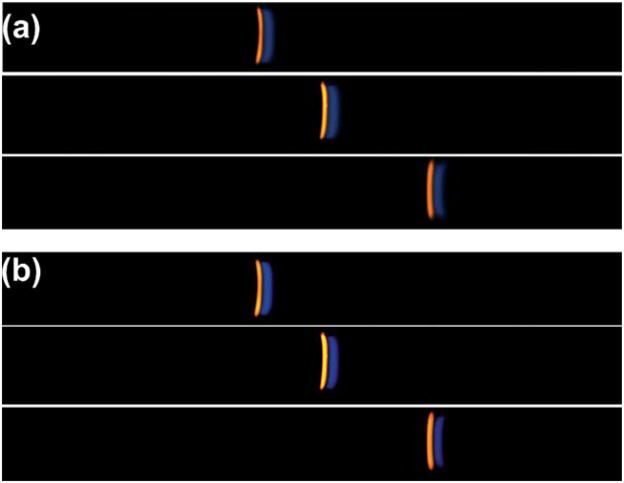
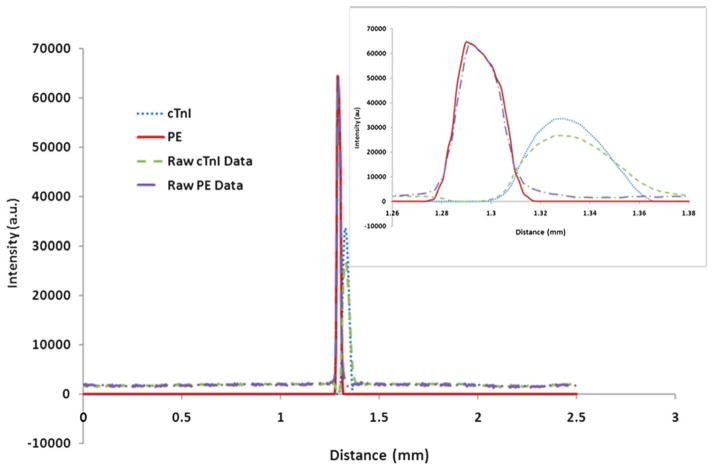
This paper describes the preconcentration of the biomarker cardiac troponin I (cTnI) and a fluorescent protein (R-phycoerythrin) using cationic isotachophoresis (ITP) in a 3.9 cm long poly(methyl methacrylate) (PMMA) microfluidic chip. The microfluidic chip includes a channel with a 5× reduction in depth and a 10× reduction in width. Thus, the overall cross-sectional area decreases by 50× from inlet (anode) to outlet (cathode). The concentration is inversely proportional to the cross-sectional area so that as proteins migrate through the reductions, the concentrations increase proportionally. In addition, the proteins gain additional concentration by ITP. We observe that by performing ITP in a cross-sectional area reducing microfluidic chip we can attain concentration factors greater than 10,000. The starting concentration of cTnI was 2.3 μg mL⁻¹ and the final concentration after ITP concentration in the microfluidic chip was 25.52 ± 1.25 mg mL⁻¹. To the author's knowledge this is the first attempt at concentrating the cardiac biomarker cTnI by ITP. This experimental approach could be coupled to an immunoassay based technique and has the potential to lower limits of detection, increase sensitivity, and quantify different isolated cTnI phosphorylation states.
Figures
Similar articles
-
Cationic isotachophoresis separation of the biomarker cardiac troponin I from a high-abundance contaminant, serum albumin.Electrophoresis. 2014 Jul;35(14):2029-38. doi: 10.1002/elps.201400009. Epub 2014 Jun 5. Electrophoresis. 2014. PMID: 24723384 Free PMC article.
-
Preconcentration and detection of the phosphorylated forms of cardiac troponin I in a cascade microchip by cationic isotachophoresis.Lab Chip. 2011 Nov 21;11(22):3793-801. doi: 10.1039/c1lc20469f. Epub 2011 Sep 21. Lab Chip. 2011. PMID: 21935555 Free PMC article.
-
10,000-fold concentration increase in proteins in a cascade microchip using anionic ITP by a 3-D numerical simulation with experimental results.Electrophoresis. 2011 Feb;32(5):550-62. doi: 10.1002/elps.201000510. Epub 2011 Feb 10. Electrophoresis. 2011. PMID: 21308695 Free PMC article.
-
Microfluidic isotachophoresis: a review.Electrophoresis. 2013 Jun;34(11):1493-509. doi: 10.1002/elps.201300021. Epub 2013 May 14. Electrophoresis. 2013. PMID: 23529957 Review.
-
Quantitative measurement of acute myocardial infarction cardiac biomarkers by "All-in-One" immune microfluidic chip for early diagnosis of myocardial infarction.Spectrochim Acta A Mol Biomol Spectrosc. 2024 Jul 5;315:124256. doi: 10.1016/j.saa.2024.124256. Epub 2024 Apr 10. Spectrochim Acta A Mol Biomol Spectrosc. 2024. PMID: 38615418 Review.
Cited by
-
Cationic isotachophoresis separation of the biomarker cardiac troponin I from a high-abundance contaminant, serum albumin.Electrophoresis. 2014 Jul;35(14):2029-38. doi: 10.1002/elps.201400009. Epub 2014 Jun 5. Electrophoresis. 2014. PMID: 24723384 Free PMC article.
-
Immunobinding-induced alteration in the electrophoretic mobility of proteins: An approach to studying the preconcentration of an acidic protein under cationic isotachophoresis.Electrophoresis. 2019 May;40(9):1314-1321. doi: 10.1002/elps.201800441. Epub 2019 Feb 7. Electrophoresis. 2019. PMID: 30656700 Free PMC article.
-
Isotachophoresis: Theory and Microfluidic Applications.Chem Rev. 2022 Aug 10;122(15):12904-12976. doi: 10.1021/acs.chemrev.1c00640. Epub 2022 Jun 22. Chem Rev. 2022. PMID: 35732018 Free PMC article. Review.
-
Nondestructive nanostraw intracellular sampling for longitudinal cell monitoring.Proc Natl Acad Sci U S A. 2017 Mar 7;114(10):E1866-E1874. doi: 10.1073/pnas.1615375114. Epub 2017 Feb 21. Proc Natl Acad Sci U S A. 2017. PMID: 28223521 Free PMC article.
-
Paper-based cascade cationic isotachophoresis: Multiplex detection of cardiac markers.Talanta. 2019 Dec 1;205:120112. doi: 10.1016/j.talanta.2019.07.007. Epub 2019 Jul 2. Talanta. 2019. PMID: 31450472 Free PMC article.
References
-
- World Heatlh Organization. [accessed 6 Aug 2010.];Cardiovascular diseases. http://www.who.int/cardiovascular_diseases/en/
-
- Lloyd-Jones D, Adams R, Carnethon M, De Simone G, Ferguson TB, Flegal K, Ford E, Furie K, Go A, Greenlund K, Haase N, Hailpern S, Ho M, Howard V, Kissela B, Kittner S, Lackland D, Lisabeth L, Marelli A, McDermott M, Meigs J, Mozaffarian D, Nichol G, O’Donnell C, Roger V, Rosamond W, Sacco R, Sorlie P, Stafford R, Steinberger J, Thom T, Wasserthiel-Smoller S, Wong N, Wylie-Rosett J, Hong Y M Writing Group; and for the American heart association statistics committee and stroke statistics. Circulation. 2009;119:e21–e181. - PubMed
-
- Wang JY, Wang XQ, Ren L, Wang Q, Li L, Liu WM, Wan ZF, Yang LY, Sun P, Ren LL, Li ML, Wu H, Wang JF, Zhangt L. Anal Chem. 2009;81:6210–6217. - PubMed
-
- Kannel WB, Stokes J, Abbott RD. Circulation. 1984;70:160. - PubMed
-
- Jaffe AS, Ravkilde J, Roberts R, Naslund U, Apple FS, Galvani M, Katus H. Circulation. 2000;102:1216–1220. - PubMed
Publication types
MeSH terms
Substances
Grants and funding
LinkOut - more resources
Full Text Sources
Other Literature Sources
Research Materials