. 2011 Nov;21(6):652-60.
doi: 10.1111/j.1750-3639.2011.00488.x. Epub 2011 Apr 24.

Non-resolving aspects of acute inflammation after spinal cord injury (SCI): indices and resolution plateau

Affiliations

Non-resolving aspects of acute inflammation after spinal cord injury (SCI): indices and resolution plateau

Harald Prüss et al. Brain Pathol. 2011 Nov.

Abstract

Inflammatory resolution is an active, highly regulated process already encoded at the onset of inflammation and required to prevent the transition into chronic inflammation associated with spreading of tissue injury and exacerbated scarring. We introduce objective, quantitative measurements [resolution indices (R(i) ) and resolution plateau (R(P) )] to characterize inflammatory resolution and to determine the persistence ("dwell time") of differential leukocyte subpopulations at the lesion site after acute experimental spinal cord injury (SCI). The cell type-specific resolution interval R(i) (time between maximum cell numbers and the point when they are reduced to 50%) ranges from 1.2 days for neutrophils, 1.5 days for T lymphocytes, to 55 days for microglia/macrophages. As the resolution interval neglects exiting cell trafficking in the later period of resolution (49%-0% of lesional cells), we introduced the R(P) , a marker for the persisting, chronified leukocyte subsets, which are likely to participate in late degeneration and non-resolving inflammation. Here, we identify the acute inflammatory response in central nervous system (CNS) lesions as partly non self-limiting. Both extended resolution intervals (reduced leukocyte clearance) and elevated plateaus (permanent lesional cell numbers) provide quantitative measures to characterize residual, sustained inflammation and define cognate timeframes of impaired resolution after acute SCI.


Figures

Figure 1
Figure 1
Indices that describe the resolution of inflammation. Based on cell trafficking into and away from inflammatory lesions, integrative indices were established to quantitatively determine the main events of resolution. These include Ψmax (the maximum number of infiltrating cells), Tmax (the time point when cell numbers reach maximum) and the resolution interval Ri (the time between the maximum and the point when cells numbers are reduced by 50%).
Figure 2
Figure 2
Time course of accumulation and clearance of leukocytes at the lesion site after SCI. Negative controls with IgG1 isotype antibodies (A) or omission of the primary antibody using only secondary goat anti‐mouse (B) and anti‐rabbit antibodies (C) confirmed the specificity of the immunostainings. Lesional accumulation of different inflammatory cell populations was quantified after 1, 3, 7, 14, 28 and 70 days post SCI (n = 5 animals per group) and compared with sham‐operated animals (n = 3). MPO+ neutrophil numbers reached maximum at day 3 and declined rapidly to the control level (D). Histological staining confirmed the presence of polymorphonuclear MPO+ neutrophils at the lesion site 3 days post injury (E), whereas they were completely absent within the scar formation 70 days after SCI (F). The time course of ED1+ microglia/macrophages reached maximum numbers at day 7 (G) with huge numbers accumulating at the lesion core (H). Microglia/macrophage numbers declined slowly and remained markedly elevated (G) with many foamy microglia/macrophages intermingled in the scar formation at day 70 (I). Maximum numbers of W3/13+ T lymphocytes were observed at day 3 and decreased rapidly but did not disappear completely from the injury site (J). W3/13+ T lymphocytes were detected frequently within the lesion area (K). A small but constant proportion of T lymphocytes could be detected until day 70 at the injury site (L). Numbers of labeled cells are plotted as mean ± SD. Green bars indicate the period of prevailing cell clearance after peak accumulation (even though resolution starts already at the onset of inflammation, the green bars indicate the time window where leukocyte clearance >cell entry). Scale bar: 100 µm in panels A–C, 50 µm in panels E, F, H, I, K, L.
Figure 3
Figure 3
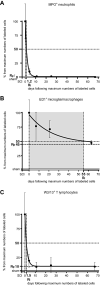
Leukocyte subtype‐specific resolution capacity after acute inflammation. Whereas neutrophils completely disappeared between 4 and 10 weeks after SCI (A), macrophages and T lymphocytes constituted a resolution plateau of persisting cells in the lesion area (B–C). Macrophages decreased slowly and approximated to their plateau of about 45% that can be predicted with reasonable certainty from nonlinear regression analysis (B). T cells reached their plateau early with about 10% of cells compared with the maximum numbers (C). The cell‐specific resolution index Ri can be determined from the curve at the time when cell numbers decreased by 50% as indicated by shaded areas between the dotted lines. Broken lines indicate the cell‐specific resolution plateau Rp. Percentages of labeled cells are plotted as mean ± SD.
Figure 5
Figure 5
Non‐resolving acute CNS inflammation. Model of a resolution deficit with respect to the resolution plateau RP. Based on (i) the assumption that tissue‐persisting leukocytes might enhance secondary damage after CNS injury, and (ii) given the current evidence of a quantifiable resolution plateau RP, we propose that the resolution plateau represents a numerical equivalent of a resolution deficit, which determines whether resolution of inflammation is complete (A, RP = 0%), incomplete (B, 0 < RP <100%) or absent (C). Thus, the resolution plateau is proposed to complement the Ri in organs of non‐complete resolution. Here the RP defines sustained chronic CNS inflammation at the cellular level.
Figure 4
Figure 4
Changes in the macrophage/microglia phenotype during the resolution period. At days 7 and 14 after SCI, a moderate proportion (20%–30%) of ED1+ cells (DAB) displayed thickened branched protrusions indicating activated microglia, which were mainly detected at the lesion border (A). At the same time, densely packed foamy macrophages with many irregular inclusions and eccentric nuclei were observed at the lesion site (B). At day 70, most ED1+ cells were large‐sized foamy macrophages (>90%), intermingled in the scar formation and showing small cytoplasmatic edges between the inclusions (C). Double labeling with CD8 (Fast Blue) revealed that about 50% of the ED1+ cells were CD8+ during the observation period between day 7 (D) and day 70 (E). Scale Bar: 25 µm. DAB = diaminobenzidine.

References

    1. Arvanian VL, Schnell L, Lou L, Golshani R, Hunanyan A, Ghosh A et al (2009) Chronic spinal hemisection in rats induces a progressive decline in transmission in uninjured fibers to motoneurons. Exp Neurol 216:471–480. - PMC - PubMed
    1. Bannenberg G, Chiang N, Ariel A, Arita M, Tjonahen E, Gotlinger K et al (2005) Molecular circuits of resolution: formation and actions of resolvins and protectins. J Immunol 174:4345–4355. - PubMed
    1. Beschorner R, Nguyen TD, Gozalan F, Pedal I, Mattern R, Schluesener HJ et al (2002) CD14 expression by activated parenchymal microglia/macrophages and infiltrating monocytes following human traumatic brain injury. Acta Neuropathol 103:541–549. - PubMed
    1. Bramlett H, Dietrich W (2007) Progressive damage after brain and spinal cord injury: pathomechanisms and treatment strategies. Prog Brain Res 161:125–141. - PubMed
    1. Brechtel K, Tura A, Abdibzadeh M, Hirsch S, Conrad S, Schwab JM (2006) Intrinsic locomotor outcome in dorsal transection of rat spinal cord: predictive value of minimal incision depth. Spinal Cord 44:605–613. - PubMed

Publication types