

Development of melanopsin-based irradiance detecting circuitry
- PMID: 21418557
- PMCID: PMC3070623
- DOI: 10.1186/1749-8104-6-8
Development of melanopsin-based irradiance detecting circuitry
Abstract
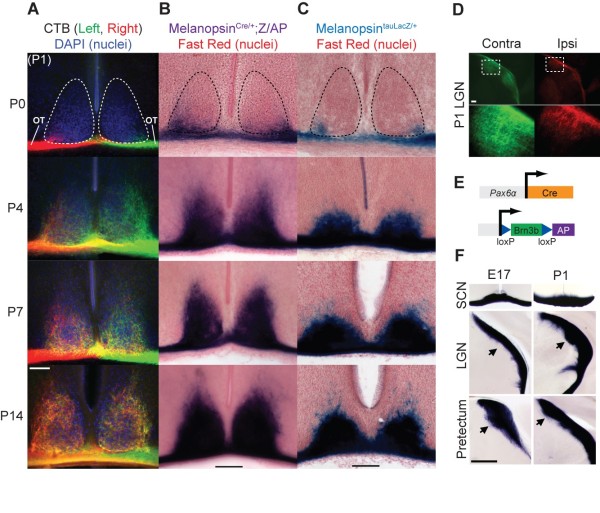
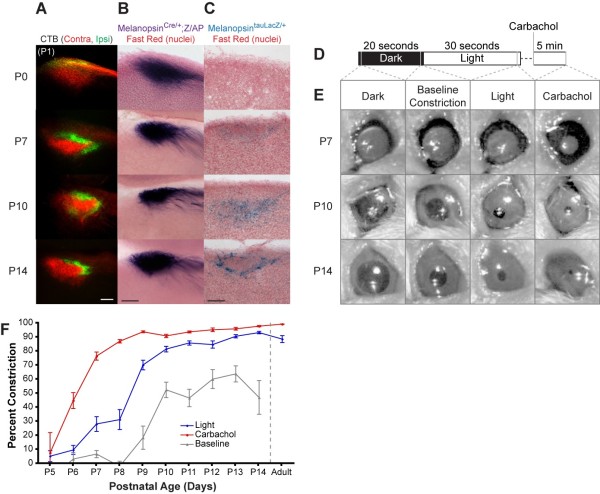
Background: Most retinal ganglion cells (RGCs) convey contrast and motion information to visual brain centers. Approximately 2% of RGCs are intrinsically photosensitive (ipRGCs), express melanopsin and are necessary for light to modulate specific physiological processes in mice. The ipRGCs directly target the suprachiasmatic nucleus (SCN) to photoentrain circadian rhythms, and the olivary pretectal nucleus (OPN) to mediate the pupillary light response. How and when this ipRGC circuitry develops is unknown.
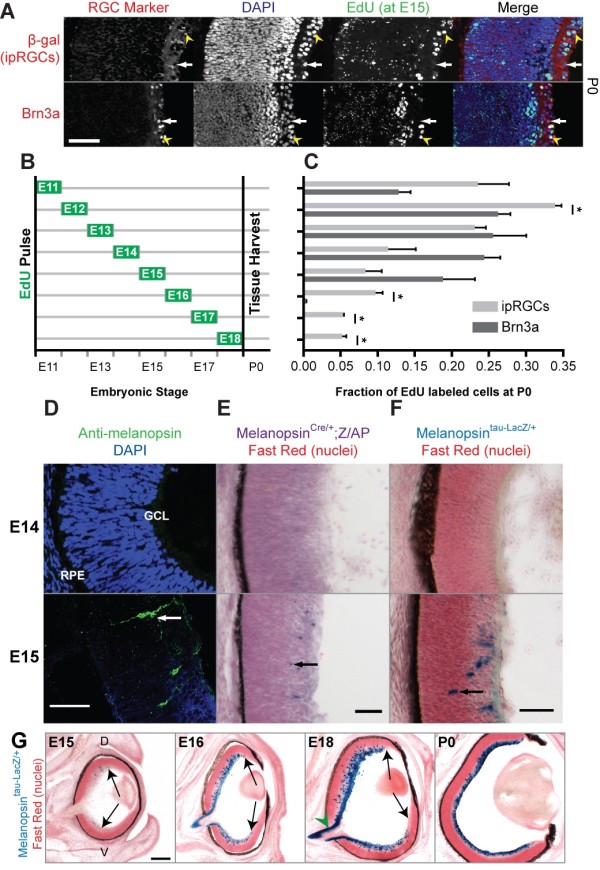
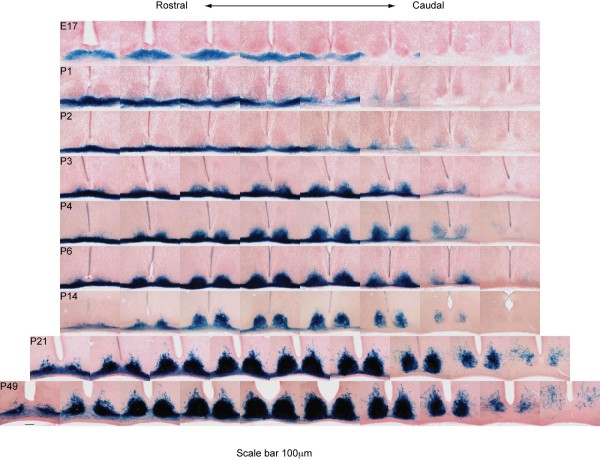
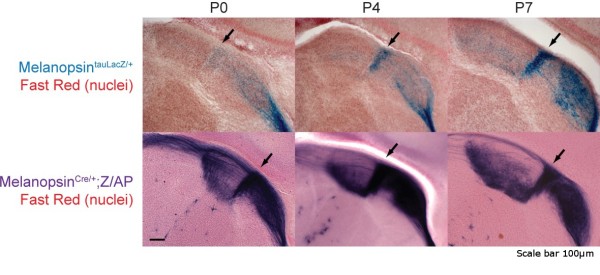
Results: Here, we show that some ipRGCs follow a delayed developmental time course relative to other image-forming RGCs. Specifically, ipRGC neurogenesis extends beyond that of other RGCs, and ipRGCs begin innervating the SCN at postnatal ages, unlike most RGCs, which innervate their image-forming targets embryonically. Moreover, the appearance of ipRGC axons in the OPN coincides precisely with the onset of the pupillary light response.
Conclusions: Some ipRGCs differ not only functionally but also developmentally from RGCs that mediate pattern-forming vision.
Figures
Similar articles
-
Two types of melanopsin retinal ganglion cell differentially innervate the hypothalamic suprachiasmatic nucleus and the olivary pretectal nucleus.Eur J Neurosci. 2008 Apr;27(7):1763-70. doi: 10.1111/j.1460-9568.2008.06149.x. Epub 2008 Mar 25. Eur J Neurosci. 2008. PMID: 18371076
-
Divergent projection patterns of M1 ipRGC subtypes.J Comp Neurol. 2018 Sep 1;526(13):2010-2018. doi: 10.1002/cne.24469. Epub 2018 Aug 2. J Comp Neurol. 2018. PMID: 29888785 Free PMC article.
-
Diminished pupillary light reflex at high irradiances in melanopsin-knockout mice.Science. 2003 Jan 10;299(5604):245-7. doi: 10.1126/science.1077293. Science. 2003. PMID: 12522249
-
Intrinsically photosensitive retinal ganglion cells.Sci China Life Sci. 2010 Jan;53(1):58-67. doi: 10.1007/s11427-010-0024-5. Epub 2010 Feb 12. Sci China Life Sci. 2010. PMID: 20596956 Review.
-
Can We See with Melanopsin?Annu Rev Vis Sci. 2020 Sep 15;6:453-468. doi: 10.1146/annurev-vision-030320-041239. Epub 2020 Jun 3. Annu Rev Vis Sci. 2020. PMID: 32491960 Review.
Cited by
-
Genesis of the Master Circadian Pacemaker in Mice.Front Neurosci. 2021 Mar 23;15:659974. doi: 10.3389/fnins.2021.659974. eCollection 2021. Front Neurosci. 2021. PMID: 33833665 Free PMC article. Review.
-
Selective amplification of ipRGC signals accounts for interictal photophobia in migraine.Proc Natl Acad Sci U S A. 2020 Jul 21;117(29):17320-17329. doi: 10.1073/pnas.2007402117. Epub 2020 Jul 6. Proc Natl Acad Sci U S A. 2020. PMID: 32632006 Free PMC article.
-
Intrinsically photosensitive retinal ganglion cells: many subtypes, diverse functions.Trends Neurosci. 2011 Nov;34(11):572-80. doi: 10.1016/j.tins.2011.07.001. Epub 2011 Aug 3. Trends Neurosci. 2011. PMID: 21816493 Free PMC article. Review.
-
Shedding light on class-specific wiring: development of intrinsically photosensitive retinal ganglion cell circuitry.Mol Neurobiol. 2011 Dec;44(3):321-9. doi: 10.1007/s12035-011-8199-8. Epub 2011 Aug 23. Mol Neurobiol. 2011. PMID: 21861091 Free PMC article. Review.
-
Differential expression of melanopsin isoforms Opn4L and Opn4S during postnatal development of the mouse retina.PLoS One. 2012;7(4):e34531. doi: 10.1371/journal.pone.0034531. Epub 2012 Apr 5. PLoS One. 2012. PMID: 22496826 Free PMC article.
References
-
- Guler AD, Ecker JL, Lall GS, Haq S, Altimus CM, Liao HW, Barnard AR, Cahill H, Badea TC, Zhao H, Hankins MW, Berson DM, Lucas RJ, Yau KW, Hattar S. Melanopsin cells are the principal conduits for rod-cone input to non-image-forming vision. Nature. 2008;453:102–105. doi: 10.1038/nature06829. - DOI - PMC - PubMed
Publication types
MeSH terms
Substances
Grants and funding
LinkOut - more resources
Full Text Sources
Molecular Biology Databases
Research Materials
