. 2011;15(2):R99.
doi: 10.1186/cc10112. Epub 2011 Mar 21.

Programmed death-1 levels correlate with increased mortality, nosocomial infection and immune dysfunctions in septic shock patients

Affiliations

Programmed death-1 levels correlate with increased mortality, nosocomial infection and immune dysfunctions in septic shock patients

Caroline Guignant et al. Crit Care. 2011.

Abstract

Introduction: Septic shock remains a major health care problem worldwide. Sepsis-induced immune alterations are thought to play a major role in patients' mortality and susceptibility to nosocomial infections. Programmed death-1 (PD-1) receptor system constitutes a newly described immunoregulatory pathway that negatively controls immune responses. It has recently been shown that PD-1 knock-out mice exhibited a lower mortality in response to experimental sepsis. The objective of the present study was to investigate PD-1-related molecule expressions in septic shock patients.

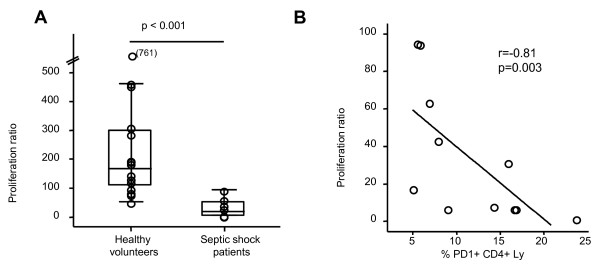
Methods: This prospective and observational study included 64 septic shock patients, 13 trauma patients and 49 healthy individuals. PD-1-related-molecule expressions were measured by flow cytometry on circulating leukocytes. Plasmatic interleukin (IL)-10 concentration as well as ex vivo mitogen-induced lymphocyte proliferation were assessed.

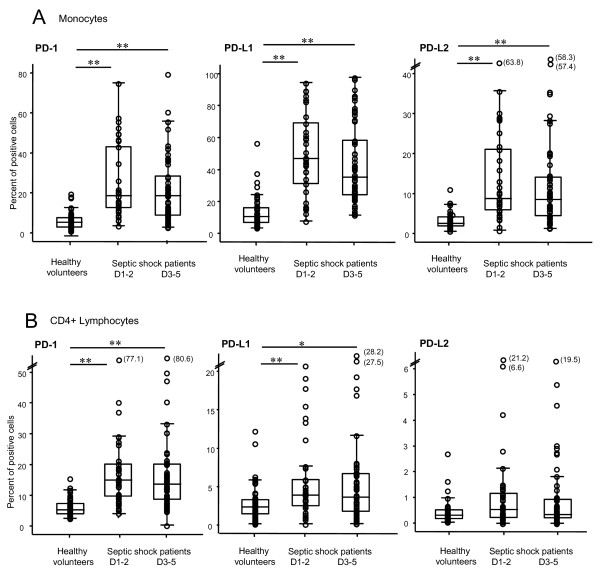
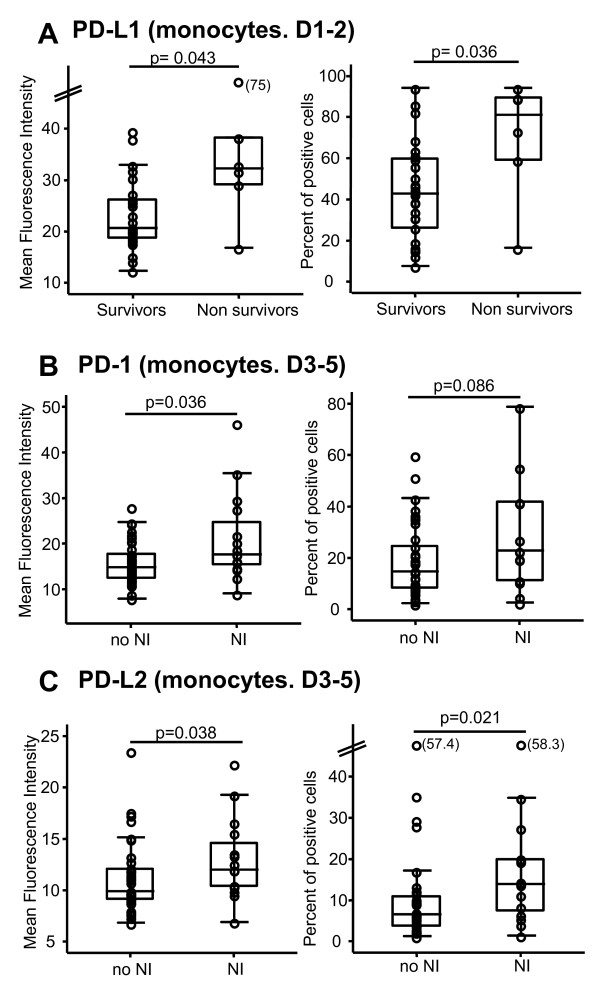
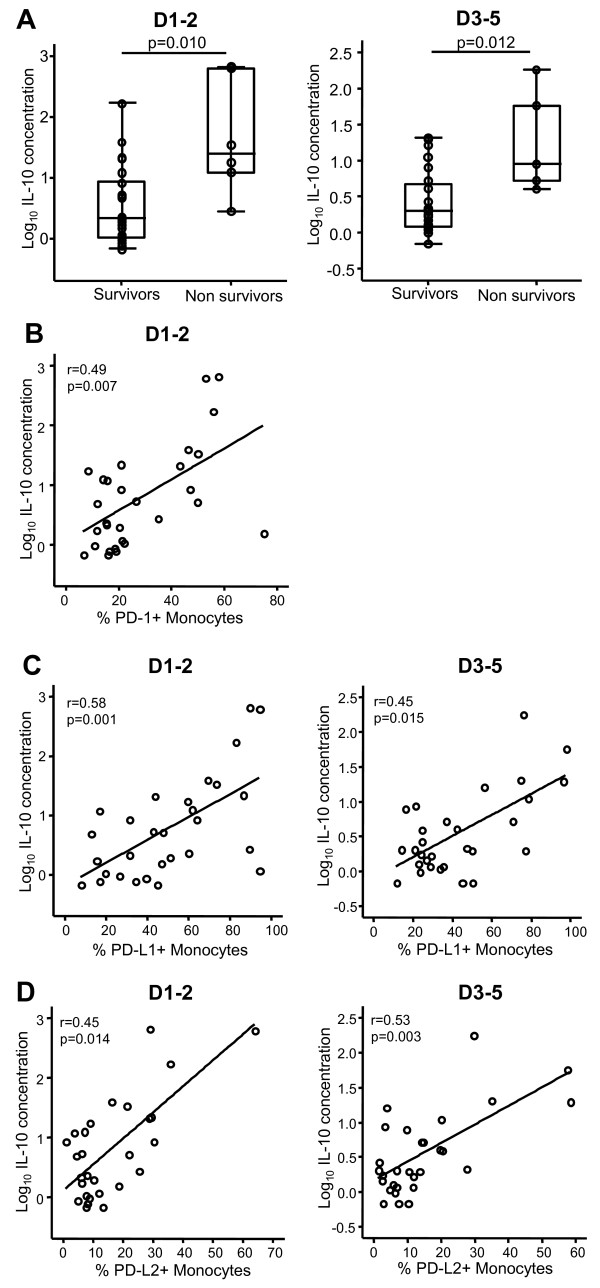
Results: We observed that septic shock patients displayed increased PD-1, PD-Ligand1 (PD-L1) and PD-L2 monocyte expressions and enhanced PD-1 and PD-L1 CD4+ T lymphocyte expressions at day 1-2 and 3-5 after the onset of shock in comparison with patients with trauma and healthy volunteers. Importantly, increased expressions were associated with increased occurrence of secondary nosocomial infections and mortality after septic shock as well as with decreased mitogen-induced lymphocyte proliferation and increased circulating IL-10 concentration.

Conclusions: These findings indicate that PD-1-related molecules may constitute a novel immunoregulatory system involved in sepsis-induced immune alterations. Results should be confirmed in a larger cohort of patients. This may offer innovative therapeutic perspectives on the treatment of this hitherto deadly disease.


Figures

Figure 1
Figure 1
PD-1, PD-L1, and PD-L2 measurements on circulating CD4+ lymphocytes and monocytes in septic shock patients and healthy volunteers. PD-1-related molecule expressions were measured on circulating monocytes (a) and CD4+ lymphocytes (b) in whole blood from healthy volunteers (n = 49) and septic shock patients at day 1 to 2 (D1-2) (n = 37) and at day 3 to 5 (D3-5) (n = 56) after the onset of shock. Results are presented as percentages of positive cells among total population of monocytes or CD4+ lymphocytes and as box-plots and individual values. *P < 0.020, **P ≤ 0.002 (Mann-Whitney U test). A P value of less than 0.025 was considered statistically significant (with correction for the number of tests). PD-1, programmed death-1; PD-L1, programmed death-ligand 1; PD-L2, programmed death-ligand 2.
Figure 2
Figure 2
Sequential PD-1, PD-L1, and PD-L2 measurements on circulating CD4+ lymphocytes and monocytes in patients with septic shock. In 10 patients with septic shock, sequential blood samples were obtained at day 1 to 2 (D1-2), day 3 to 5 (D3-5), and day 6 to 10 (D6-10) after the onset of shock, and percentages of PD-1-, PD-L1-, and PD-L2-positive CD4+ lymphocytes (black diamonds) and monocytes (white squares) were measured by flow cytometry. Results are expressed as mean ± standard error of the mean. The Friedman test was performed: P values were greater than 0.05 for all of the analyses. PD-1, programmed death-1; PD-L1, programmed death-ligand 1; PD-L2, programmed death-ligand 2.
Figure 3
Figure 3
PD-1-related molecule expressions on monocytes and clinical outcomes. (a) Monocyte PD-L1 expression was measured on 26 survivors and 6 non-survivors at day 1 to 2 (D1-2) after the onset of septic shock. Monocyte PD-1 (b) and PD-L2 (c) expressions were measured at day 3 to 5 (D3-5) after the onset of shock on 15 patients who developed a secondary nosocomial infection during their intensive care unit stay (NI) and 38 patients who remained free of secondary infection (no NI). Flow cytometry data are expressed as (left) mean fluorescence intensities and (right) percentages of positive cells out of total circulating monocytes. Results are presented as box-plots as well as individual values. The Mann-Whitney U test was performed. PD-1, programmed death-1; PD-L1, programmed death-ligand 1; PD-L2, programmed death-ligand 2.
Figure 4
Figure 4
Plasma IL-10 concentration and PD-1 expression in patients with septic shock. (a) Plasma IL-10 concentration was measured in survivors and non-survivors at day 1 to 2 (D1-2) (n = 23 and n = 6, respectively) and at day 3 to 5 (D3-5) (n = 24 and n = 5, respectively) after septic shock. Results are presented as box-plots and as individual values, and horizontal lines represent medians. The Mann-Whitney U test was performed. (b-d) Correlations between increased plasma IL-10 concentration and increased PD-1 (b), PD-L1 (c), and PD-L2 (d) expressions on monocytes were calculated at D1-2 and D3-5 in 29 patients with septic shock. The Spearman correlation test was used to assess statistical significance. IL-10, interleukin-10; PD-1, programmed death-1; PD-L1, programmed death-ligand 1; PD-L2, programmed death-ligand 2.
Figure 5
Figure 5
Lymphocyte proliferation and PD-1 expression in septic shock patients and healthy volunteers. (a) Lymphocyte proliferation was measured in 16 healthy volunteers and 11 septic shock patients (at day 3 to 5, or D3-5) by 3H-thymidine incorporation after stimulation with phytohemagglutinin (5 μg/mL). The proliferation ratio was calculated as the ratio between the numbers of count per minute in the stimulated wells, divided by non-stimulated wells. Results are presented as box-plots as well as individual values. Statistical significance was calculated using the Mann-Whitney U test. (b) The correlation between percentages of PD-1+CD4+ lymphocytes (Ly) and proliferation ratio was assessed in 11 patients with septic shock at D3-5. The Spearman correlation test was performed. PD-1, programmed death-1.

References

    1. Hotchkiss RS, Karl IE. The pathophysiology and treatment of sepsis. N Engl J Med. 2003;348:138–150. doi: 10.1056/NEJMra021333. - DOI - PubMed
    1. Dombrovskiy VY, Martin AA, Sunderram J, Paz HL. Rapid increase in hospitalization and mortality rates for severe sepsis in the United States: a trend analysis from 1993 to 2003. Crit Care Med. 2007;35:1244–1250. doi: 10.1097/01.CCM.0000261890.41311.E9. - DOI - PubMed
    1. Angus DC, Linde-Zwirble WT, Lidicker J, Clermont G, Carcillo J, Pinsky MR. Epidemiology of severe sepsis in the United States: analysis of incidence, outcome, and associated costs of care. Crit Care Med. 2001;29:1303–1310. doi: 10.1097/00003246-200107000-00002. - DOI - PubMed
    1. Vincent JL, Sakr Y, Sprung CL, Ranieri VM, Reinhart K, Gerlach H, Moreno R, Carlet J, Le Gall JR, Payen D. Sepsis in European intensive care units: results of the SOAP study. Crit Care Med. 2006;34:344–353. doi: 10.1097/01.CCM.0000194725.48928.3A. - DOI - PubMed
    1. Munford RS, Pugin J. Normal responses to injury prevent systemic inflammation and can be immunosuppressive. Am J Respir Crit Care Med. 2001;163:316–321. - PubMed

Publication types

MeSH terms