. 2011 May 20;408(5):863-78.
doi: 10.1016/j.jmb.2011.03.019. Epub 2011 Mar 23.

Role of the tail in the regulated state of myosin 2

Affiliations

Role of the tail in the regulated state of myosin 2

Hyun Suk Jung et al. J Mol Biol. .

Abstract

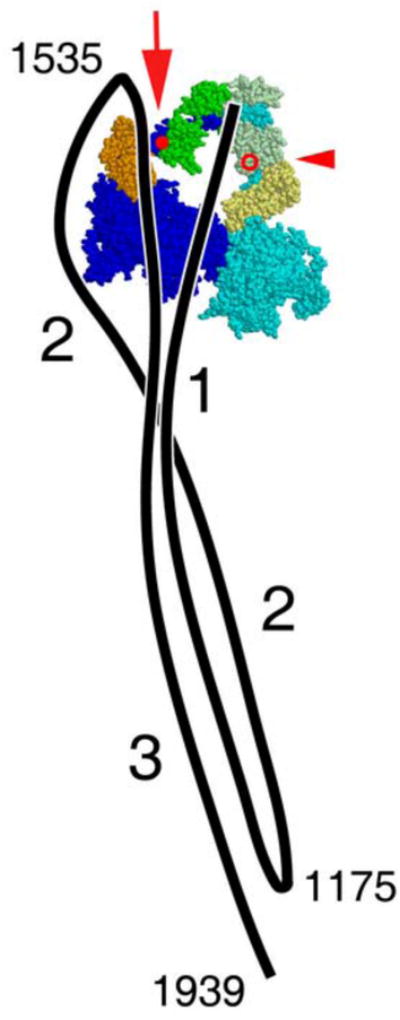
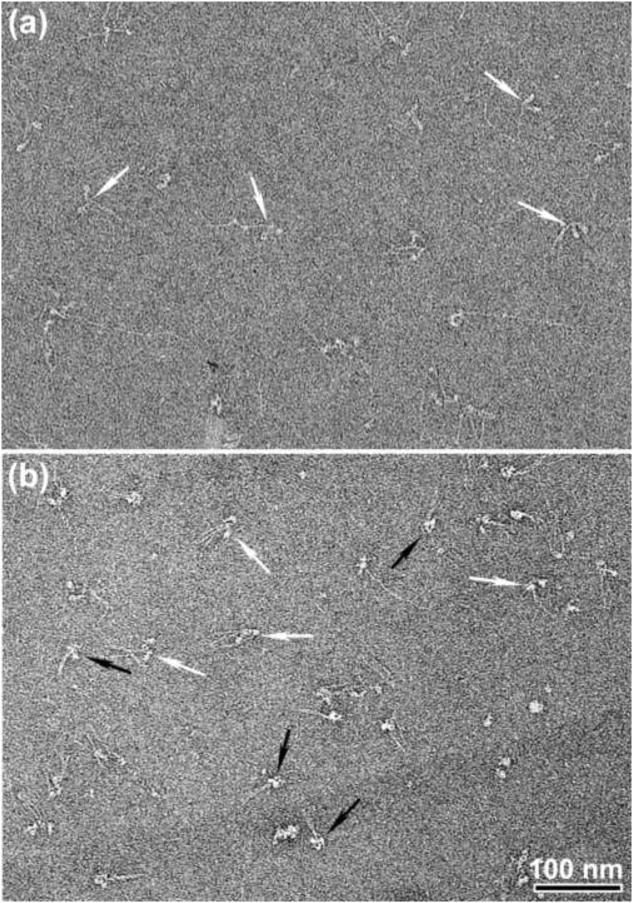
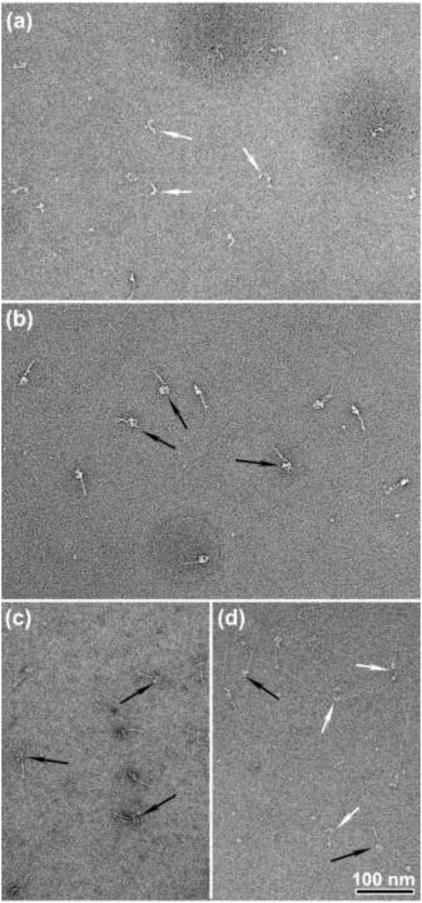
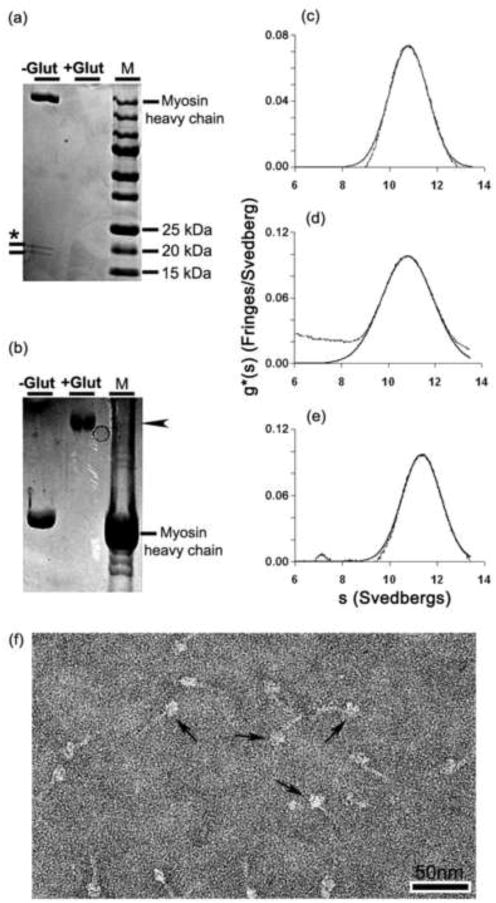
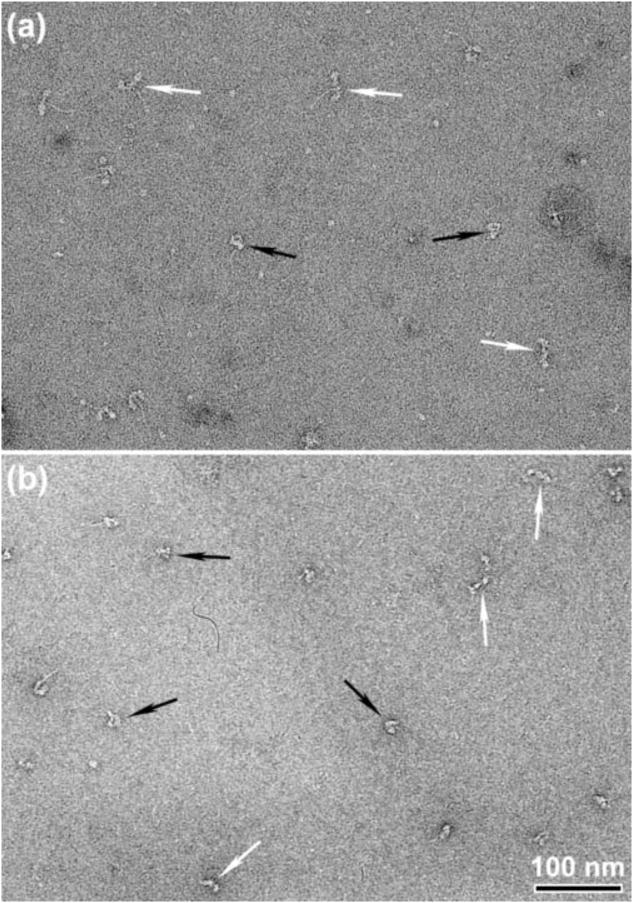
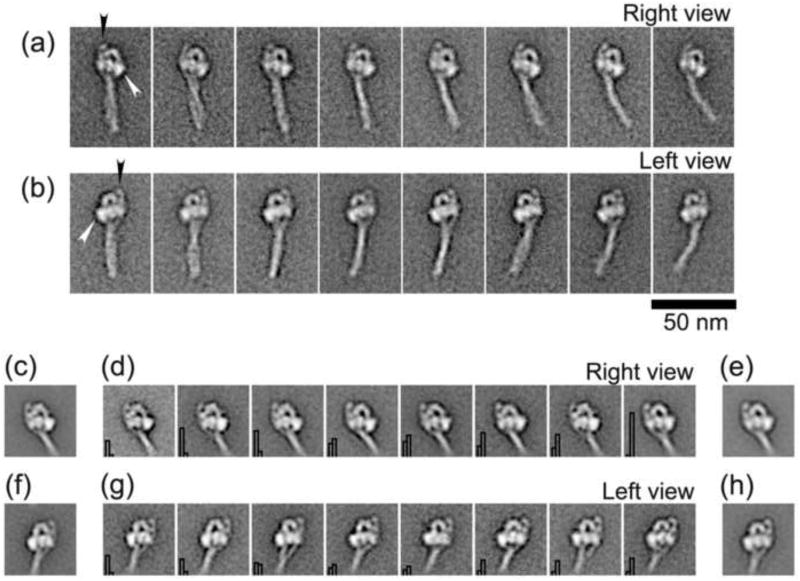
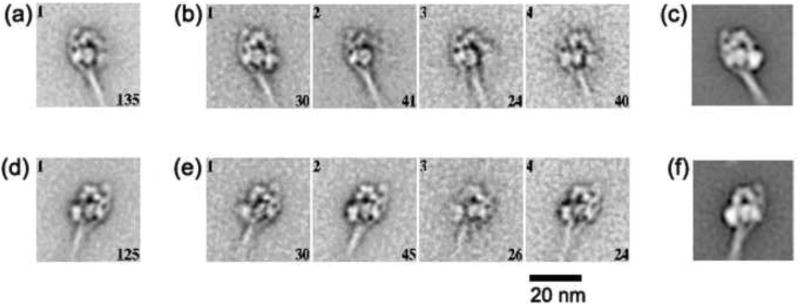
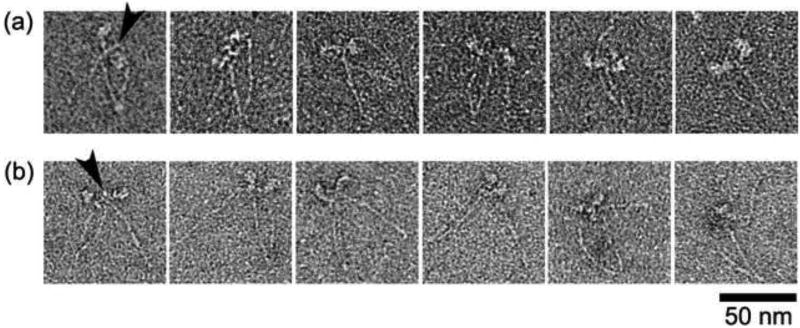
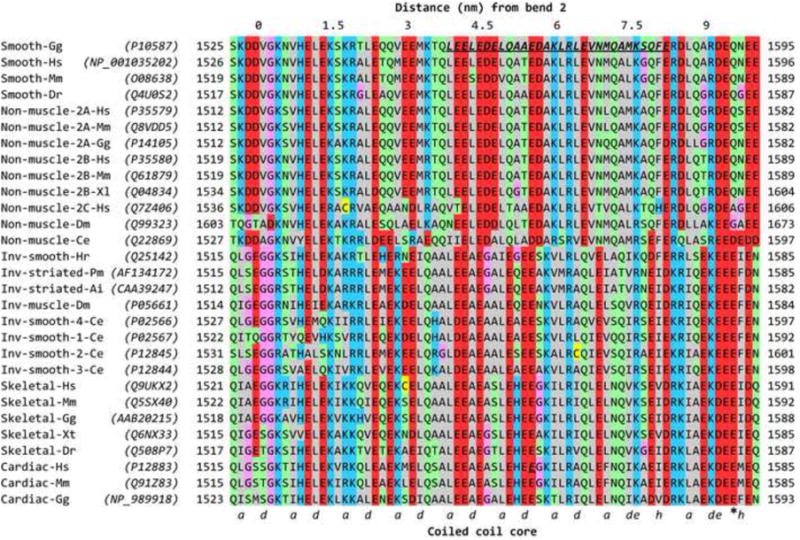
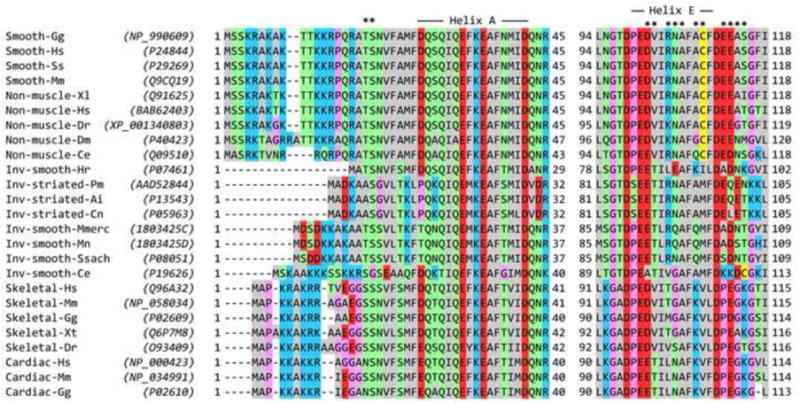
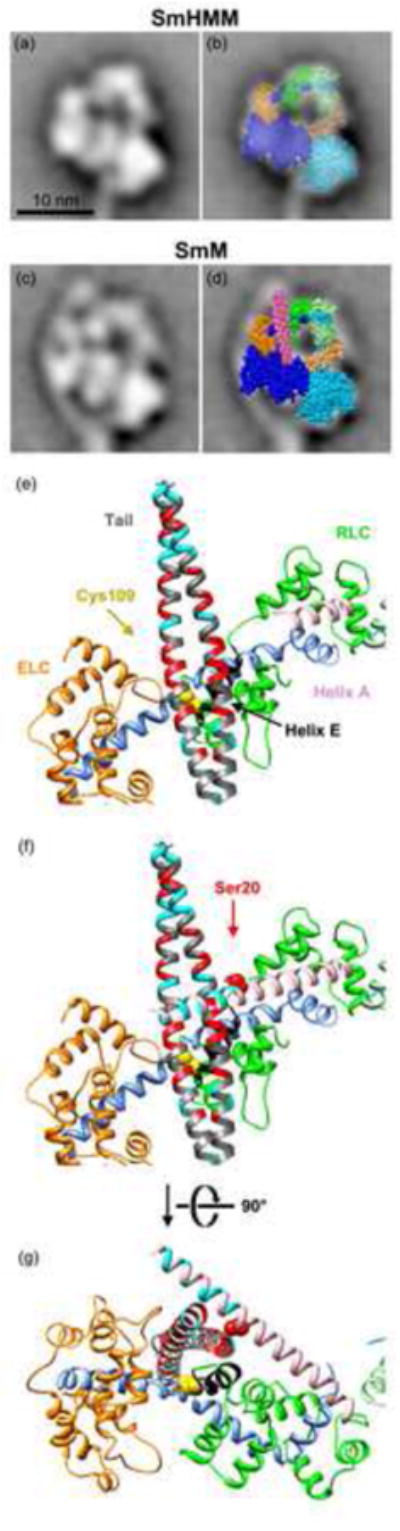
Myosin 2 from vertebrate smooth muscle or non-muscle sources is in equilibrium between compact, inactive monomers and thick filaments under physiological conditions. In the inactive monomer, the two heads pack compactly together, and the long tail is folded into three closely packed segments that are associated chiefly with one of the heads. The molecular basis of the folding of the tail remains unexplained. By using electron microscopy, we show that compact monomers of smooth muscle myosin 2 have the same structure in both the native state and following specific, intramolecular photo-cross-linking between Cys109 of the regulatory light chain (RLC) and segment 3 of the tail. Nonspecific cross-linking between lysine residues of the folded monomer by glutaraldehyde also does not perturb the compact conformation and stabilizes it against unfolding at high ionic strength. Sequence comparisons across phyla and myosin 2 isoforms suggest that the folding of the tail is stabilized by ionic interactions between the positively charged N-terminal sequence of the RLC and a negatively charged region near the start of tail segment 3 and that phosphorylation of the RLC could perturb these interactions. Our results support the view that interactions between the heads and the distal tail perform a critical role in regulating activity of myosin 2 molecules through stabilizing the compact monomer conformation.


Figures

Figure 1
Figure 1
Diagram of the compact, 10 S conformation of SmM as seen by negative stain EM, adapted from ref. A diagram of the path of the tail (black line) is superposed on an atomic model of the heads in the shutdown state. In the tail, the three segments are labelled, as are the proposed SmM heavy chain sequence positions of the two bends and the end of the tail. For clarity, outside the head region the three segments of tail are shown lying side by side, but their true disposition is unknown. In the heads, the heavy chain is coloured blue, the ELC orange, the RLC green, with the ‘free’ head (right) in paler shades than the ‘blocked’ head (left). The molecule is shown in ‘right view’, i.e. free head on the right. In the blocked head, RLC Cys109, used in cross-linking experiments reported here, is marked by the red spot, emphasised by the large red arrow, and tail segment 3 has been displaced to the left locally to expose this residue (see also Fig. 10). In the free head, RLC Cys109 is on the far side of the molecule; its position is marked by the red circle, emphasised by the small red arrowhead.
Figure 2
Figure 2
ATP-induced structural changes in intact SmM molecules at low ionic strength. Negatively stained EM fields of SmM molecules, (a) In the absence of ATP and (b) in the presence of ∼ 25 μM MgATP (see Materials and Methods). White and black arrows indicate non-compact and compact molecules, respectively. Scale bar: 100nm.
Figure 3
Figure 3
Appearance of SmM cross-linked with glutaraldehyde. (a) SmM in a solution containing 0.15 M KCl was reacted with 0.1% glutaraldehyde for 1 min in the absence of ATP and diluted 20-fold to 10 nM for microscopy. (b) Same as (a), but reacted in the presence of 0.5 mM MgATP. (c) Same as (b) but diluted with a solution containing 0.5 M KCl after cross-linking. (d) Same as (c) but cross-linked using 0.05% glutaraldehyde. Black or white arrows indicate compact or extended SmM molecules respectively. Scale bar: 100nm.
Figure 4
Figure 4
Comparison of glutaraldehyde cross-linked SmM with control SmM. (a) 4-20% and (b) 3-10% polyacrylamide gradient SDS-PAGE (a) Lane 1, control SmM. The ∼20 kDa bands marked with an asterisk are the RLC and ELC. Lane 2, glutaraldehyde-treated SmM; no bands have entered the gel. Lane 3, a 15-250 kDa ladder. (b) Lane 1, control SmM. Only the heavy chain is visible. Lane 2, glutaraldehyde-treated SmM. Lane 3, rabbit psoas myofibrils. Arrowhead in (b) indicates the cross-linked myosin band in lane 2. (c) Sedimentation profile of 0.1 mg/ml control SmM in 0.15 M KCl and 1 mM MgATP (see Methods); peak has s20,w = 10.80 S. (d) Same as (c) but with 70 mM ethanolamine-HCl added; peak has s20,w = 10.83 S. (e) Sedimentation profile of SmM treated with 0.1% glutaraldehyde followed by a 70 mM ethanolamine-HCl quench; peak has s20,w = 11.36 S. ∼25% of controls and ∼30% of cross-linked SmM sedimented faster (sedimentation coefficients of 80 S and 100 S, respectively). (f) Negatively stained molecules of the cross-linked and quenched sample used in (e); arrows indicate examples of compact molecules. Scale bar: 50nm.
Figure 5
Figure 5
Appearance of glutaraldehyde-treated and control SmHMM. (a) Field of negatively stained SmHMM in 35 mM KCl and 25 μM MgATP. (b) Same as (a) but treated with 0.1% glutaraldehyde at 0.15 M KCl prior to dilution to 35 mM KCl for EM. Black arrows highlight compact molecules and white arrows highlight non-compact molecules. Scale bar: 100 nm.
Figure 6
Figure 6
Comparison of glutaraldehyde cross-linked and control compact SmM molecules. (a) & (b) Galleries of selected averaged images produced from the processed images of 724 (right view) and 1806 (left view) cross-linked SmM molecules. Right and left view orientations are defined according to the disposition of the free head, which is indicated by white arrowheads (see also Fig. 1). Black arrowheads point to the prominent spot beside the blocked head, which is the second bend in the tail. (c) & (e) Average of right view control SmM (491 images) and cross-linked SmM (498 images), respectively. (f) & (h) Average of left view control SmM (303 images) and cross-linked SmM (301 images), respectively. (d) & (g) Representative class averages of the head region of SmM molecules possessing compact structure, produced from co-alignment and co-classification of a combined stack of images from either right or left views, respectively, of control and cross-linked molecules. Histogram in the bottom left of each panel shows the proportion of control (left bar) and cross-linked (right bar) molecules. Panels arranged in order of increasing proportion of cross-linked particles. 50 nm scale bar applies to all images.
Figure 7
Figure 7
Single particle imaging of photo-cross-linked SmM. Global and four class averages of SmM molecules that were intramolecularly photo-cross-linked between Cys109 of one RLC and segment 3 of the tail in low ionic strength conditions in the presence of MgATP. (a) and (b) produced from 135 right views; (d) and (e) produced from 125 left views. The number of images incorporated into each class average is shown in the lower right corner of each panel, and the class number is in the upper left. (c) and (f) show right and left views of control SmM for comparison. Scale bar: 20 nm.
Figure 8
Figure 8
Sites of head-tail interaction in non-compact SmM in the presence of MgATP. (a) Examples of non-compact molecules observed in low ionic strength conditions (see also white arrows in Fig. 2b). (b) Examples of photo-cross-linked, non-compact molecules in high ionic strength conditions. Arrowheads point to the interacting sites between the head and the distal tail. Scale bar: 50 nm.
Figure 9
Figure 9
Sequence alignments and structural features of myosin 2 heavy chains and RLCs. Residue numbering includes the N-terminal Met, so residue numbers (indicated at both ends of each sequence) may be higher than used in some literature. (a) Alignment of myosin heavy chains near the start of tail segment 3, including the part that passes over the RLC. Labelling above the Table shows (at 0) the approximate position of bend 2 of the folded tail, and consequently the distance along tail segment 3 based on ∼0.15 nm length per residue in the coiled coil. Labelling below the Table shows assignment of the residues (a and d) of the heptad repeat that form the central core of the coiled coil. The assignment includes the two hendecad (11-residue; hence a, de and h core residues) stutters caused by an additional, ‘skip’ residue that is nominally assigned to the position of the asterisk (E1590 in Cardiac-Gg). In Smooth-Gg (top row), bold, italic, underlined residues indicate the region to which a cross-link is made from RLC Cys109 in compact SmM. In Cardiac-Hs, Glu1555 is highlighted in the same way (see text). (b) Alignment of RLCs in the N-terminal region (left) and Helix E region (right). In the left part, asterisks mark the position of the phosphorylatable Thr and Ser residues, and the extent of Helix A is shown. In the right part, the extent of Helix E is shown, and the asterisks mark residues in this helix and the adjacent E-F loop that could interact with tail segment 3. Sequence accession numbers for heavy chains and RLCs are shown in parentheses in (a) and (b). ClustalW was used for alignments, and Jalview was used for display, and manual adjustment of gaps at the N-terminal region of RLCs in (b). The colour scheme is: hydrophobic (AFILMVWY), grey; positive-charged (HKR), blue; negative-charged (DE), red; hydrophilic (NQST), green; conformationally-special (GP), pink; cysteine (C), yellow. Inv means invertebrate. Species codes: Ai Argopecten irradians; Ce Caenorhabditis elegans; Cn Chlamys nipponensis akazara; Dm Drosophila melanogaster; Dr Danio radio; Gg Gallus gallus; Hr Halocynthia roretzi; Hs Homo sapiens; Mm Mus musculus; Mmerc Mercenaria mercenaria; Mn Macrocallista nimbosa; Pm Pecten maximus; Ss Sus scrofa; Ssach Spisula sachalinensis; Xl Xenopus laevis; Xt Xenopus tropicalis.
Figure 9
Figure 9
Sequence alignments and structural features of myosin 2 heavy chains and RLCs. Residue numbering includes the N-terminal Met, so residue numbers (indicated at both ends of each sequence) may be higher than used in some literature. (a) Alignment of myosin heavy chains near the start of tail segment 3, including the part that passes over the RLC. Labelling above the Table shows (at 0) the approximate position of bend 2 of the folded tail, and consequently the distance along tail segment 3 based on ∼0.15 nm length per residue in the coiled coil. Labelling below the Table shows assignment of the residues (a and d) of the heptad repeat that form the central core of the coiled coil. The assignment includes the two hendecad (11-residue; hence a, de and h core residues) stutters caused by an additional, ‘skip’ residue that is nominally assigned to the position of the asterisk (E1590 in Cardiac-Gg). In Smooth-Gg (top row), bold, italic, underlined residues indicate the region to which a cross-link is made from RLC Cys109 in compact SmM. In Cardiac-Hs, Glu1555 is highlighted in the same way (see text). (b) Alignment of RLCs in the N-terminal region (left) and Helix E region (right). In the left part, asterisks mark the position of the phosphorylatable Thr and Ser residues, and the extent of Helix A is shown. In the right part, the extent of Helix E is shown, and the asterisks mark residues in this helix and the adjacent E-F loop that could interact with tail segment 3. Sequence accession numbers for heavy chains and RLCs are shown in parentheses in (a) and (b). ClustalW was used for alignments, and Jalview was used for display, and manual adjustment of gaps at the N-terminal region of RLCs in (b). The colour scheme is: hydrophobic (AFILMVWY), grey; positive-charged (HKR), blue; negative-charged (DE), red; hydrophilic (NQST), green; conformationally-special (GP), pink; cysteine (C), yellow. Inv means invertebrate. Species codes: Ai Argopecten irradians; Ce Caenorhabditis elegans; Cn Chlamys nipponensis akazara; Dm Drosophila melanogaster; Dr Danio radio; Gg Gallus gallus; Hr Halocynthia roretzi; Hs Homo sapiens; Mm Mus musculus; Mmerc Mercenaria mercenaria; Mn Macrocallista nimbosa; Pm Pecten maximus; Ss Sus scrofa; Ssach Spisula sachalinensis; Xl Xenopus laevis; Xt Xenopus tropicalis.
Figure 10
Figure 10
Model of the interaction between the distal SmM tail and the blocked head RLC. (a) Averaged image of SmHMM. (b) As (a), with superposed spacefill atomic model showing interaction between heads of SmHMM, oriented to best fit the EM image; heavy chains blue, ELC orange, RLC green, free head depicted in paler colours. (c) Averaged image of SmM, co-aligned with (a). (d) As (c) with superposed atomic model of HMM in identical position and orientation as in (b), and with spacefill atomic model of part of SmM tail (chick Val1529 to Gln1592; magenta) positioned to show path of tail segment 3 from the second bend across the blocked head RLC. See also Fig. 1 for the entire path of the tail. (e) Magnified view of the lever region of the blocked head and SmM tail in a backbone ribbon depiction of the atomic models shown in (d). These are shown in the same orientation as in (d) and the colour scheme is the same except: RLC helix A, pink; RLC Cys109 yellow spacefill; rest of RLC helix E (which is partly obscured under the tail), black; tail segment 3 shown with Lys and Arg residues coloured cyan, and Asp and Glu residues coloured red; the tail peptide shown to cross-link to Cys109 (starting at Leu1555; see also Fig. 9a) is depicted as flat ribbons rather than rounded ones. In choosing an azimuth for tail segment 3 (i.e. rotation of the segment around its own long axis), we have supposed that the two chains of the coiled coil are superposed at the second bend, i.e. at the start of segment 3, in order that both tail segments 2 and 3 lie in the plane of the page. (f) As (e) but with the ‘missing’ N-terminal residues of the RLC modelled as a continuation of Helix A; Lys and Arg residues coloured cyan, and Ser20, site of phosphorylation, coloured as red spacefill. (g) As (f) but rotated by 90° about the transverse axis to show the spatial relationship between the RLC, tail and N-terminal extension of Helix A. Panels (e) to (g) were produced using the UCSF Chimera package from the Resource for Biocomputing, Visualization, and Informatics at the University of California, San Francisco (supported by NIH P41 RR001081).

References

    1. Onishi H, Wakabayashi T, Kamata T, Watanabe S. Electron microscopic studies of myosin molecules from chicken gizzard muscle II: the effect of thiophosphorylation of the 20K-Dalton light chain on the ATP-induced change in the conformation of myosin monomers. J Biochem. 1983;94:1147–1154. - PubMed
    1. Trybus KM, Lowey S. Conformational states of smooth muscle myosin - Effects of light chain phosphorylation and ionic strength. J Biol Chem. 1984;259:8564–8571. - PubMed
    1. Trybus KM, Huiatt TW, Lowey S. A bent monomeric conformation of myosin from smooth muscle. Proc Natl Acad Sci USA. 1982;79:6151–6155. - PMC - PubMed
    1. Craig R, Smith R, Kendrick-Jones J. Light-chain phosphorylation controls the conformation of vertebrate non-muscle and smooth muscle myosin molecules. Nature. 1983;302:436–439. - PubMed
    1. Ankrett RJ, Rowe AJ, Cross RA, Kendrick-Jones J, Bagshaw CR. A folded (10 S) conformer of myosin from a striated muscle and its implications for regulation of ATPase activity. J Mol Biol. 1991;217:323–335. - PubMed

Publication types

Substances

LinkOut - more resources